This is getting really interesting

with 2 Comments

o On the archeology front, Rannveig found this article about the possibility of a new Viking site being excavated in Newfoundland. They must have stopped along the way from Scandinavia, and Skalanes seems like a nice place for that. Who knows what we’ll find.

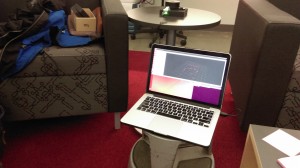
o Nic has made some progress with LIDAR, although the gear is proving to be a bit delicate. We’ll probably order a second unit to work with. Here is an early image taken during today’s meeting. The unit is on the round table, on Nic’s screen is the developing point-cloud of the room and contents. If you look very closely you can see people on couches (/very/ closely…)

IMAG0390

o We need to sort a magnetometer before long, hopefully Patrick can loan us one.

o On the logistics front we need to make plane reservations fairly soon. All the lodging and transportation is sorted modulo the ferry to Grimsey, we’ll just wing that early in the morning of the day we travel.

o I started working with our Yocto altimeter recently, we’ll use this as part of the kit that provides more accurate x, y, and z geo-coordinates than consumer grade GPS chipsets alone do.

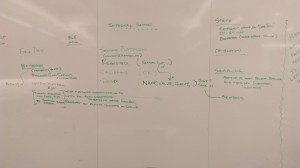
o Kristin and I worked through most of the details of the interface between FieldDay and the Arduino based sensor platforms. Here is a schematic of it, off to the left is the Postgres database where FieldDay pushes readings in CSV form.

IMAG0389

o I think it’s time we started the Iceland16 playlist, it looks like Spotify is currently the most popular platform for doing so.


BLE in Arduino and Android

with No Comments

I have accomplished quite a bit within the past week, if I do say so myself. Last week, I said that I had begun working on the BLE part of Field Day. Well, after some struggle I finished it! I am able to send a request to the Arduino device and upon receiving that request, the Arduino device sends a message back to the android device and writes to he screen (woo!). But the code is not pretty. Android provides a Bluetooth Low Service example in Android Studio, but it uses deprecated code. I researched and was able to modernize it.

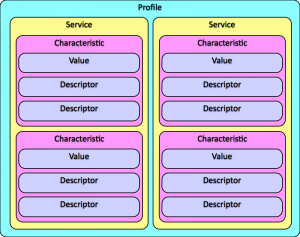
Bluetooth Low Energy is pretty complicated as a service. It uses something called GATT (Generic Attribute Profile). The bluetooth server (arduino device) has a GATT profile and within that GATT profile there are services and services have characteristics. Each service can have multiple characteristics, but there can only be one TX and one RX (read and write) characteristic per service. I learned this the hard way. You can see a diagram of what I’m talking about below.

For the arduino side, we use Red Bear Labs BLE shield. There is a standard BLE library for the arduino but it’s really complex. I’ve read over the code multiple times and I’m just now grasping a little bit of it. RBL has constructed a wrapper for that code. They broke it down into 10 or so different functions, which I must say is mighty useful. I used that when constructing the Arduino code.

During my coding of the BLE on android I discovered that most of our Fragments of sensors are all the same except for the names of them. After talking with Charlie we’ve decided that we’re going to get rid of the individual fragments for each sensors and just have one that is ‘Bluetooth Sensors.’ I’m working on moving the BLE code to that setup now. Hopefully I will be done with it within the day.


GATT

Lat Long Database Function Progress

with No Comments

To help with the bounding box interface and further data clean-up, I’m working on a function in PSQL that takes two lat long pairs and calculates the distance between them. I was able to get the function working, but before writing the update that inserts a column in the readings table with values, I want to make sure I know how to read the results my function is giving me right now.

A first degree approximation of the values my function gives me shows me that it isn’t returning values in km or miles right now. We definitely want this function to populate the table with a value that can be easily Q&A’ed( miles vs km anyone?) so I’m now going back and looking over the math of how the function works to get it to return an easily usable value.

After I have that figured out, the cleaning that Charlie will help me do that has to do with populating sectors can begin.


LIDAR or: how I learned to stop reason and love a challenge

with No Comments

So, LIDAR or light-based-radar availability and price range has dropped considerably over the years to the point of being relatively cheap even. So we jumped at that!

I spent the last bit of time jumping into working with LIDAR. The lidar unit model is capable of 10hz which translates to 2000 samples per second. I initially got the laser to work using a visualisation program known as RVIZ which is part of the Robot Operating System (ROS). ROS is sort of the de-facto open source robot/machine learning system… that being said it is brittle and with very little documentation for use outside of getting set up. I initially tried to get ROS running on my native mac OSX environment but ran into complications running on El Capitan, so ill put that off for a later date.

Through an ubuntu virtual machine (with much trial and error) I finally got a laser point visualisation, which you can see in the video below. What you are looking at is a college student in his natural habitat practicing for his entrance into the ministry of silly walks.

Some time after getting this working, the LIDAR took a small tumble off a desk and stopped working. For a total of 3 days that same college student frantically took the device apart, wiggled a few of the connections and re-aligned the laser sensor with the laser beam using a 3rd party laser source. After that it started working correctly again.

The next step is to get the laser vis into a simultaneous localization and mapping (SLAM) program.


Handlers handling handles

with 1 Comment

After some testing of the Handler implementation in Field Day, I’ve determined that it is actually working! I was finally able to look at the data that I had been writing to the database.

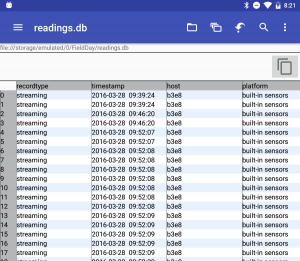
Databases in Android are stored in internal (private) memory. There are Android apps that let you look at the files on your device, but only for external storage. The internal storage is private. What I ended up doing was adding a function to write the database from internal storage to external storage. Once it was on external storage, I used a SQLite Viewer Android app to look at the database and it looks good!

I did some research into the application state when the device screen is turned off. In our old application, Seshat, the activities would die when the screen was off. That’s not good. We want to be able to turn off the screen and hang the Android device from our person some how. It’s useful to have our hands free. After a couple hours of research, I determined the libraries we want to look at are in the PowerManager library on Android, particularly the PARTIAL_WAKE_LOCK state. I wrap the methods I want to happen when the screen is off in what are essentially ‘start’ and ‘stop’ methods. The methods were not executing with the screen off, so I researched some more. I think what will ultimately happen is switching the SensorSampleActivity to a Service. A Service in Android is one of the top priority processes. It’s one of the last to die to if the device needs more memory. It can continue running even if the Activity the started it has died. Since the Activity is now working, I’m going to hold off in converting it to a Service.

The last thing I worked on this week was Bluetooth LE in Android. Tara gave me a BLE shield with an Arduino attached to test my code with those devices. Android provides a BLE example in Android Studio so I’ve been working with that. However, the example they provide has deprecated code so I’m working on modifying it to the new setup. It’s not working yet, but I’ve only been working on it for a couple of hours!

sqlite-fieldday
Sample of sqlite database on Field Day

A Continuation of GIS

with No Comments

I did some further investigation into the GIS layers that we now have. I found out some really useful information, however we need some more direction from Oli in order to be more efficient and productive in putting layers together and figuring out what is useful. I did run some conversions from vector to raster however the files were really large so I am going to try to use another tool for this conversion. Here is part of the email I sent to Oli and Rannveig:

  • There are three layer in archaeology that look similar to the map 2007 Rannveig sent. There is not any information however attached in the attribute table or just in the description.
  • Iceland layers- all pretty straightforward and informative.
  • Lupin layers
  • Eider layers
  • Terns- lots of layers with information collection of location?
There is a lot of information here but having some more direction would be helpful in putting layers together and further analyzing. Is there anything specific that you would like accomplished in considering these layers?
Once Oli responds, I will know where to go with the layers we do have. I will also be able to figure out what I will need more information on QGIS about.

Databases, and lat long functions

with No Comments

Since my last post was a a very long time ago, this is what has happened with the data clean-up over the past weeks:

Eamon and I both cleaned up all the data we could find individually. Since we’d worked separately, when we compared the cleaned data sets that we each had, they turned out to be different. Neither of us had all the data individually, but when our data sets were combined, the list was exhaustive of all permutations of Iceland 2014 and Nicaragua 2014 data. Then, with Charlie’s help, we were able to determine which of the data sets we needed to zorch. It turns out that a significant chunk of our data sets needed to be zorched, because we each had thousands of rows of testing data or data taken in the car while the group was driving.

After much too much time wrestling data in spreadsheets, the readings table is finally in the field science database where further clean-up relating to sectors and spots can be done. As of right now, most Iceland 2014 data has no sector or spot data. With Charlie’s help, I can now populate the sectors.This should be way quicker to do by date, time stamp and lat long coordinates now that we have it all in the database.

Next up, I will be working to create/adapt a function that measures the distance between a pair of lat long coordinates. This should help with further clean-up and with the bounding box interface.

There’s only 28 thousand days…

with No Comments

Actually it’s only about 80 days until we leave but Alicia Keys’ song is stuck in my head after hearing it this morning when we were working in the lab. I do know the answer to her second question, Iceland.

Eamon and Deeksha are making progress on the data, data model, and viz tool. We are going to create a function that measures the distance between two lat,lon pairs to make annotating the site information easier and to provide a hook for the bounding-box interface.  We wire-framed the viz tool UI, Eamon is going to construct a message to Patrick about open map tiles that we can cache on our devices.

Erin is chugging along with QGIS, we owe Patrick an adult beverage for suggesting that we use it. Nic recently discovered that there is a plug-in for it that supports LIDAR generated point-clouds in a layer (as a layer?).

I ran into Kelly Gaither (chair of XSEDE16) at IU on Friday, she strongly encouraged us to produce a poster for XSEDE16 on the UAS + LIDAR + machine learning package. She thinks it’s quite unique. Unfortunately she did remember me from the conference last summer when I hid under the table during the awards ceremony.

Next up for me is working on the high resolution Z platform and the soil temperature platform. I would like to work on Field Day too.

Spectroscopy and Sensor Platforms

with No Comments

Since my last blog post a very long time ago a lot has happened. Here is a breakdown by platform and by sensor:

Near IR spectroscopy: the rise and fall of the SCIO

At the time of my last post, I was eagerly awaiting the arrival of the SCIO. The machine itself was something of a disappointment. Under the hood it’s basically a tricked out CCD camera. The raw data is also completely closed. This was kind of a disappointing realization, but we rallied. Instead I am planning to try out Texas Instrument’s DLP (R) NIRscan (TM) Nano. It’s a bare bones, open source spectroscopy platform that covers an impressive 900-1700 nm range. In the meantime, Stephanie, Mike and I have been developing calibration curves for the Nano with the FTIR. The results thus far have been very promising – we have identified a peak in the IR spectrum that varies almost linearly with organic content concentration. We are also planning to take spectral data from Icelandic soil samples currently residing in Heather’s ancient DNA lab. We will follow sterile protocol and remove a small amount of soil for the FTIR scan.

I have also considered the idea of building a visible/NIR spectrometer. This would allow us to take spectral readings from the visible and IR ranges of the electromagnetic spectrum and cover more possible organic content peeks. The hardest part about building a spectrometer is not actually the optics but powering and reading the CCD. I have found a linear NIR CCD and possible arduino code for driving it, but I’m not sure if I will have time to optimize it before we leave, so I’m back burner-ing it for now until I progress more on color conversion and OC sensors.

Munsell Color and PH

Using an RGB sensor to get an approximation for Munsell color would save us time on comparison and data entry. A vis spectrometer could also corroborate Munsell color values, if I were to build one.

This week I have been learning a lot about color spaces. The RGB sensor takes values that live in RGB space. Munsell color space is a 3D space with axes (value, hue, chroma) that looks like this:

Munsell-Color-Solid-Plus-base-color-theory-300x2392000px-Munsell-system.svg


For Munsell color I have a table from RIT that converts MVH to XYZ, the colorspace bounded by spectral colors that describes colors the human eye observes, and the conversion to RGB from here is published. I will just be going backwards.

Screen Shot 2016-04-02 at 11.57.12 AM

For PH I am interested in color difference. I might be able to use XYZ like the Munsell, or I might use La*b* which is optimized for computing differences.

cie-lab


Field Sensor

The field sensor contains IR temp and soil moisture (and now i’m thinking conductivity as well). This is where I am trying to jump in with BLE. These sensors just need to pass an int or a tuple to field day. I am using a redbearlab BLE shield. The world of arduino is all pretty new to me and still confusing, but I’m making progress.

I am also jumping into openSCAD to re-design the field case to accommodate the BLE shield and IR sensor.


OC Meter

I gave up on the idea of building a scanning laser with a stepper motor. I think I can accomplish enough precision with an array of white LEDs, an array of photodetectors, and a black box. Redesigning now.


UAV Status and info!

with 1 Comment

We recently purchased and received the UAV drone, a Phantom 3 Advanced. In choosing the drone we looked at a variety of specifications but the important ones was price, flight time, range, camera, and hack-ablility. The P3 Advanced hit right in the sweet spot.

Its priced cheap enough to not break the bank (Charlie’s eyes nearly popped out of his head at the cost of some systems… Charlie might be the bank in this analogy) while providing adequate if not superb performance in other areas. Its got a flight time of ~23 minutes and capable of speeds of roughly 16m/s (35mph) and ascent/descent speeds of 5m/s and 3m/s respectively. When hovering it has a vertical accuracy of +/- 0.1m and horizontal accuracy of +/- 1.5m (more on this with LIDAR onboard). Though no built in wind resistance (fancy speak for the ability to rapidly increasing speed to offset sudden gusts of wind) a pilot monitoring the system will be able to adapt for such things. According to data we have from the Icelandic met office, though windy they have rarely been stronger than 9m/s during the months we will be there.

In terms of range the advanced has one of the best combo systems. On board its got both GPS and GLONAS(read: Russian GPS) capabilities and under perfect conditions will be able to travel up to 5000meters (yeah, thats not an extra 0) away from the ground station. Its ceiling is set at 120m from ground station but capable of working anywhere to 6000meters above sea level. This means that we will be able to set up virtually any flight path for the drone to take within our 23 minute flight before a battery switch is needed. Side note/idea: This will probably be shot down but, because of our need for solar panels with the energy survey if the panels work well we might be able to have a remote charging station for discharged batteries.

The biggest obstacle weather/flight wise will be working rain. I am looking into possible “water resistance” techniques for the drone that are similar to what videographers have done when filming around waterfalls and during mist or light rains. The most common is coating the electronics in some sort of $ever_dry_product, but before we go spraying our drone with strange substances Id like to be absolutely sure of its success. (Big note that this is only a weather resistance in the same way that if you go swimming in a rain coat you will still get wet)

The Advanced’s camera is also a pretty neat piece of technology. First off, its TINY and lightweight but capably of 2.7K(30fps) resolution video and 12MP stills (translates to roughly 4000 x 3000p). The Advanced has the capability to store the stills as DNG RAW format so they retain as much digital info as possible which we can then harvest IR and other spectrums from in post processing. With images and video this high of quality we will be able to apply photogrammetry to measure distances between objects for mapping purposes natively. With a LIDAR sensor added in we should be able to apply these two together and through machine learning get something incredibly comprehensive.

Hack-ability is pretty important for our needs, given that we as a group could probably be called a group of science hackers. There are two flavours of this hack-ableness for the drone; software and hardware. Software is pretty straight forward – DJI is kind enough to provide a developers SDK that gives us the ability to customise and use the drones capabilities. Whats going to be important is finding how we can get this information into the FieldDay app and how thats going to look. Hardware is another thing entirely though. The Phantom series is slightly like Apple in that its a beautifully designed chassis thats not really meant to be played around with (in fact, google only returns hardware changes that deal with aesthetics). So, of course our plan is to stick a modular LIDAR system on the back of it which may require quite a few body modifications!

Looking forward I’ll be planning out how our ground station will work with the drone. This is most likely going to mean a laptop computer + tablet + controller + batteries in the field (My laptop is a 13″ macbook pro with 16GB RAM and a 256GB SSD). The waypoint guide system or “drone” part of the UAV will probably be easiest to do with a laptop and we can get some fancy features from having an actual computer near at hand. The controller itself will be near by for manual piloting, this uses a tablet as view finder/some controls. At highest quality video (2.7K resolution, 30fps) the advanced will record about 3GB per 10 minutes. Given the flight time will be ~23 minutes it’s probably going to be ~8 to 10GB per flight captured with video + lidar. Luckily on board the Advanced can hold a 64GB extreme speed SD Card to help with storage. The flight data will most likely be stored on laptop in the field and then transferred to backups once at basecamp. As part of the ground station the laptop is probably going to be running some form of mapping program for real time mappings (this will be looked at further down the road).

Lastly and most important: The drone needs a name. I’ll be taking suggestions. (Kristin says Bob is not an option fyi)

I’ve mentioned a LIDAR system several times, so please look at this post for further reading!


1 10 11 12 13 14 15 16 23