Errybody in the house shakin’ dirt

with 1 Comment

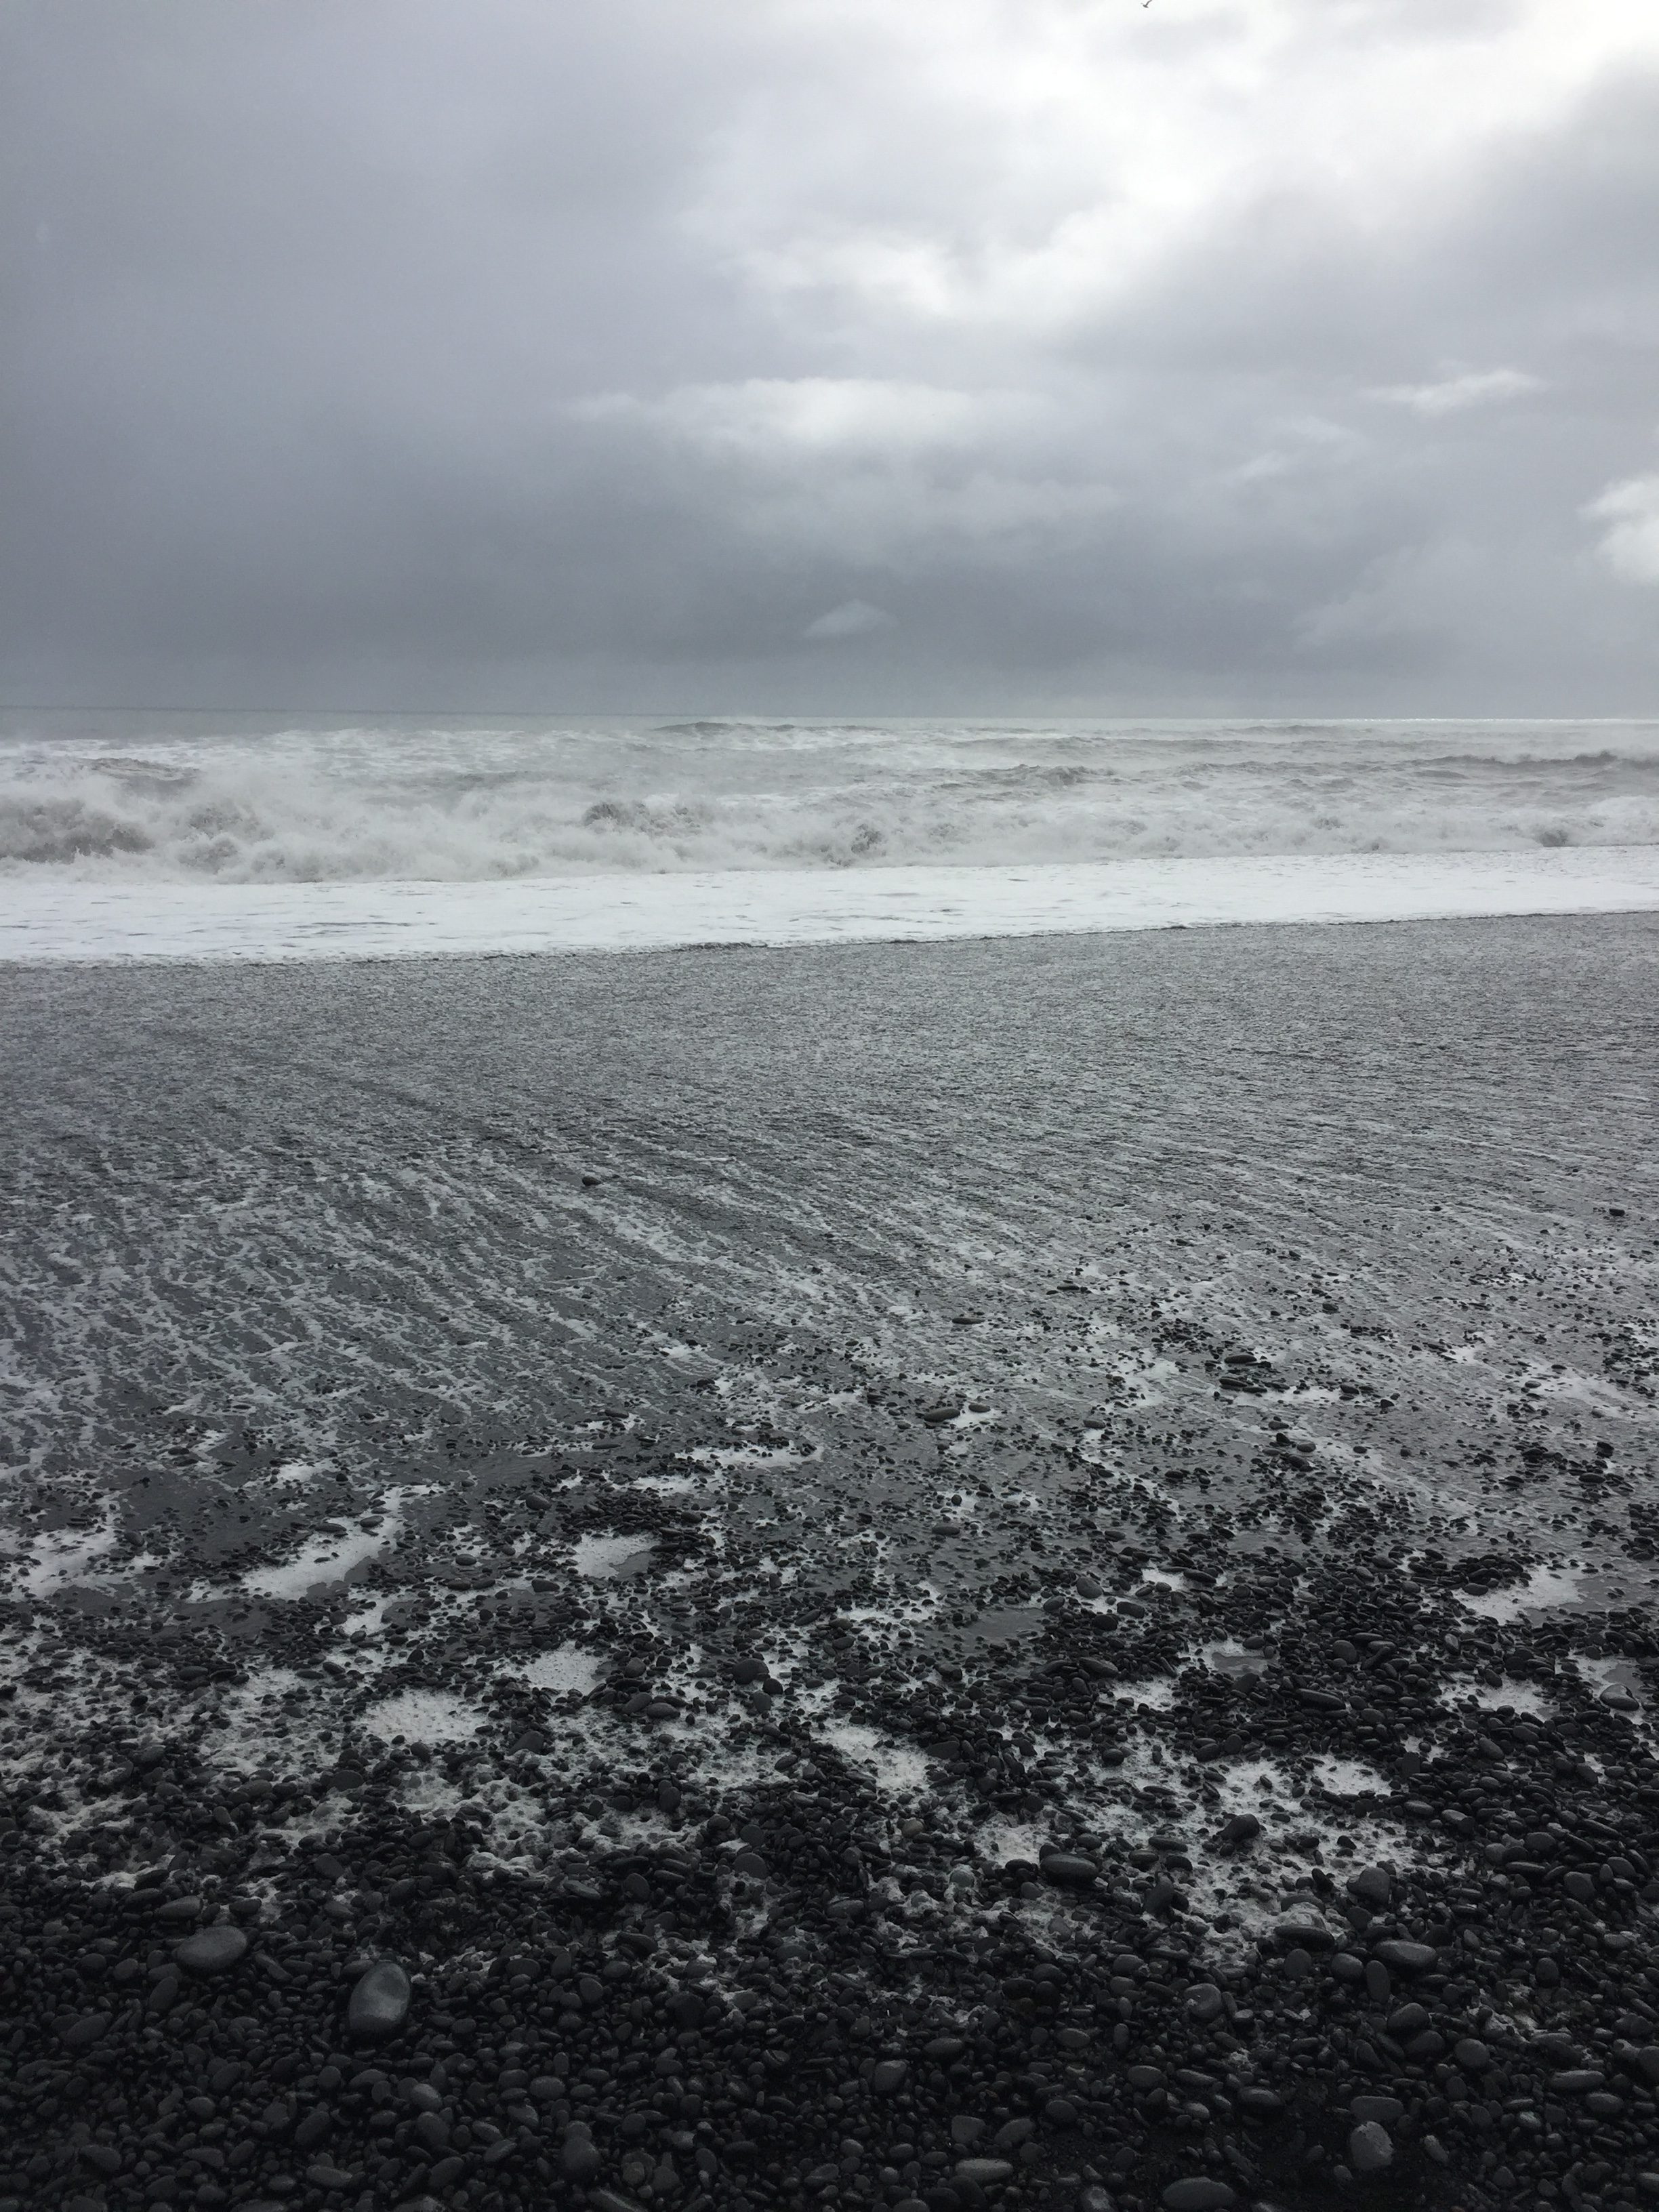
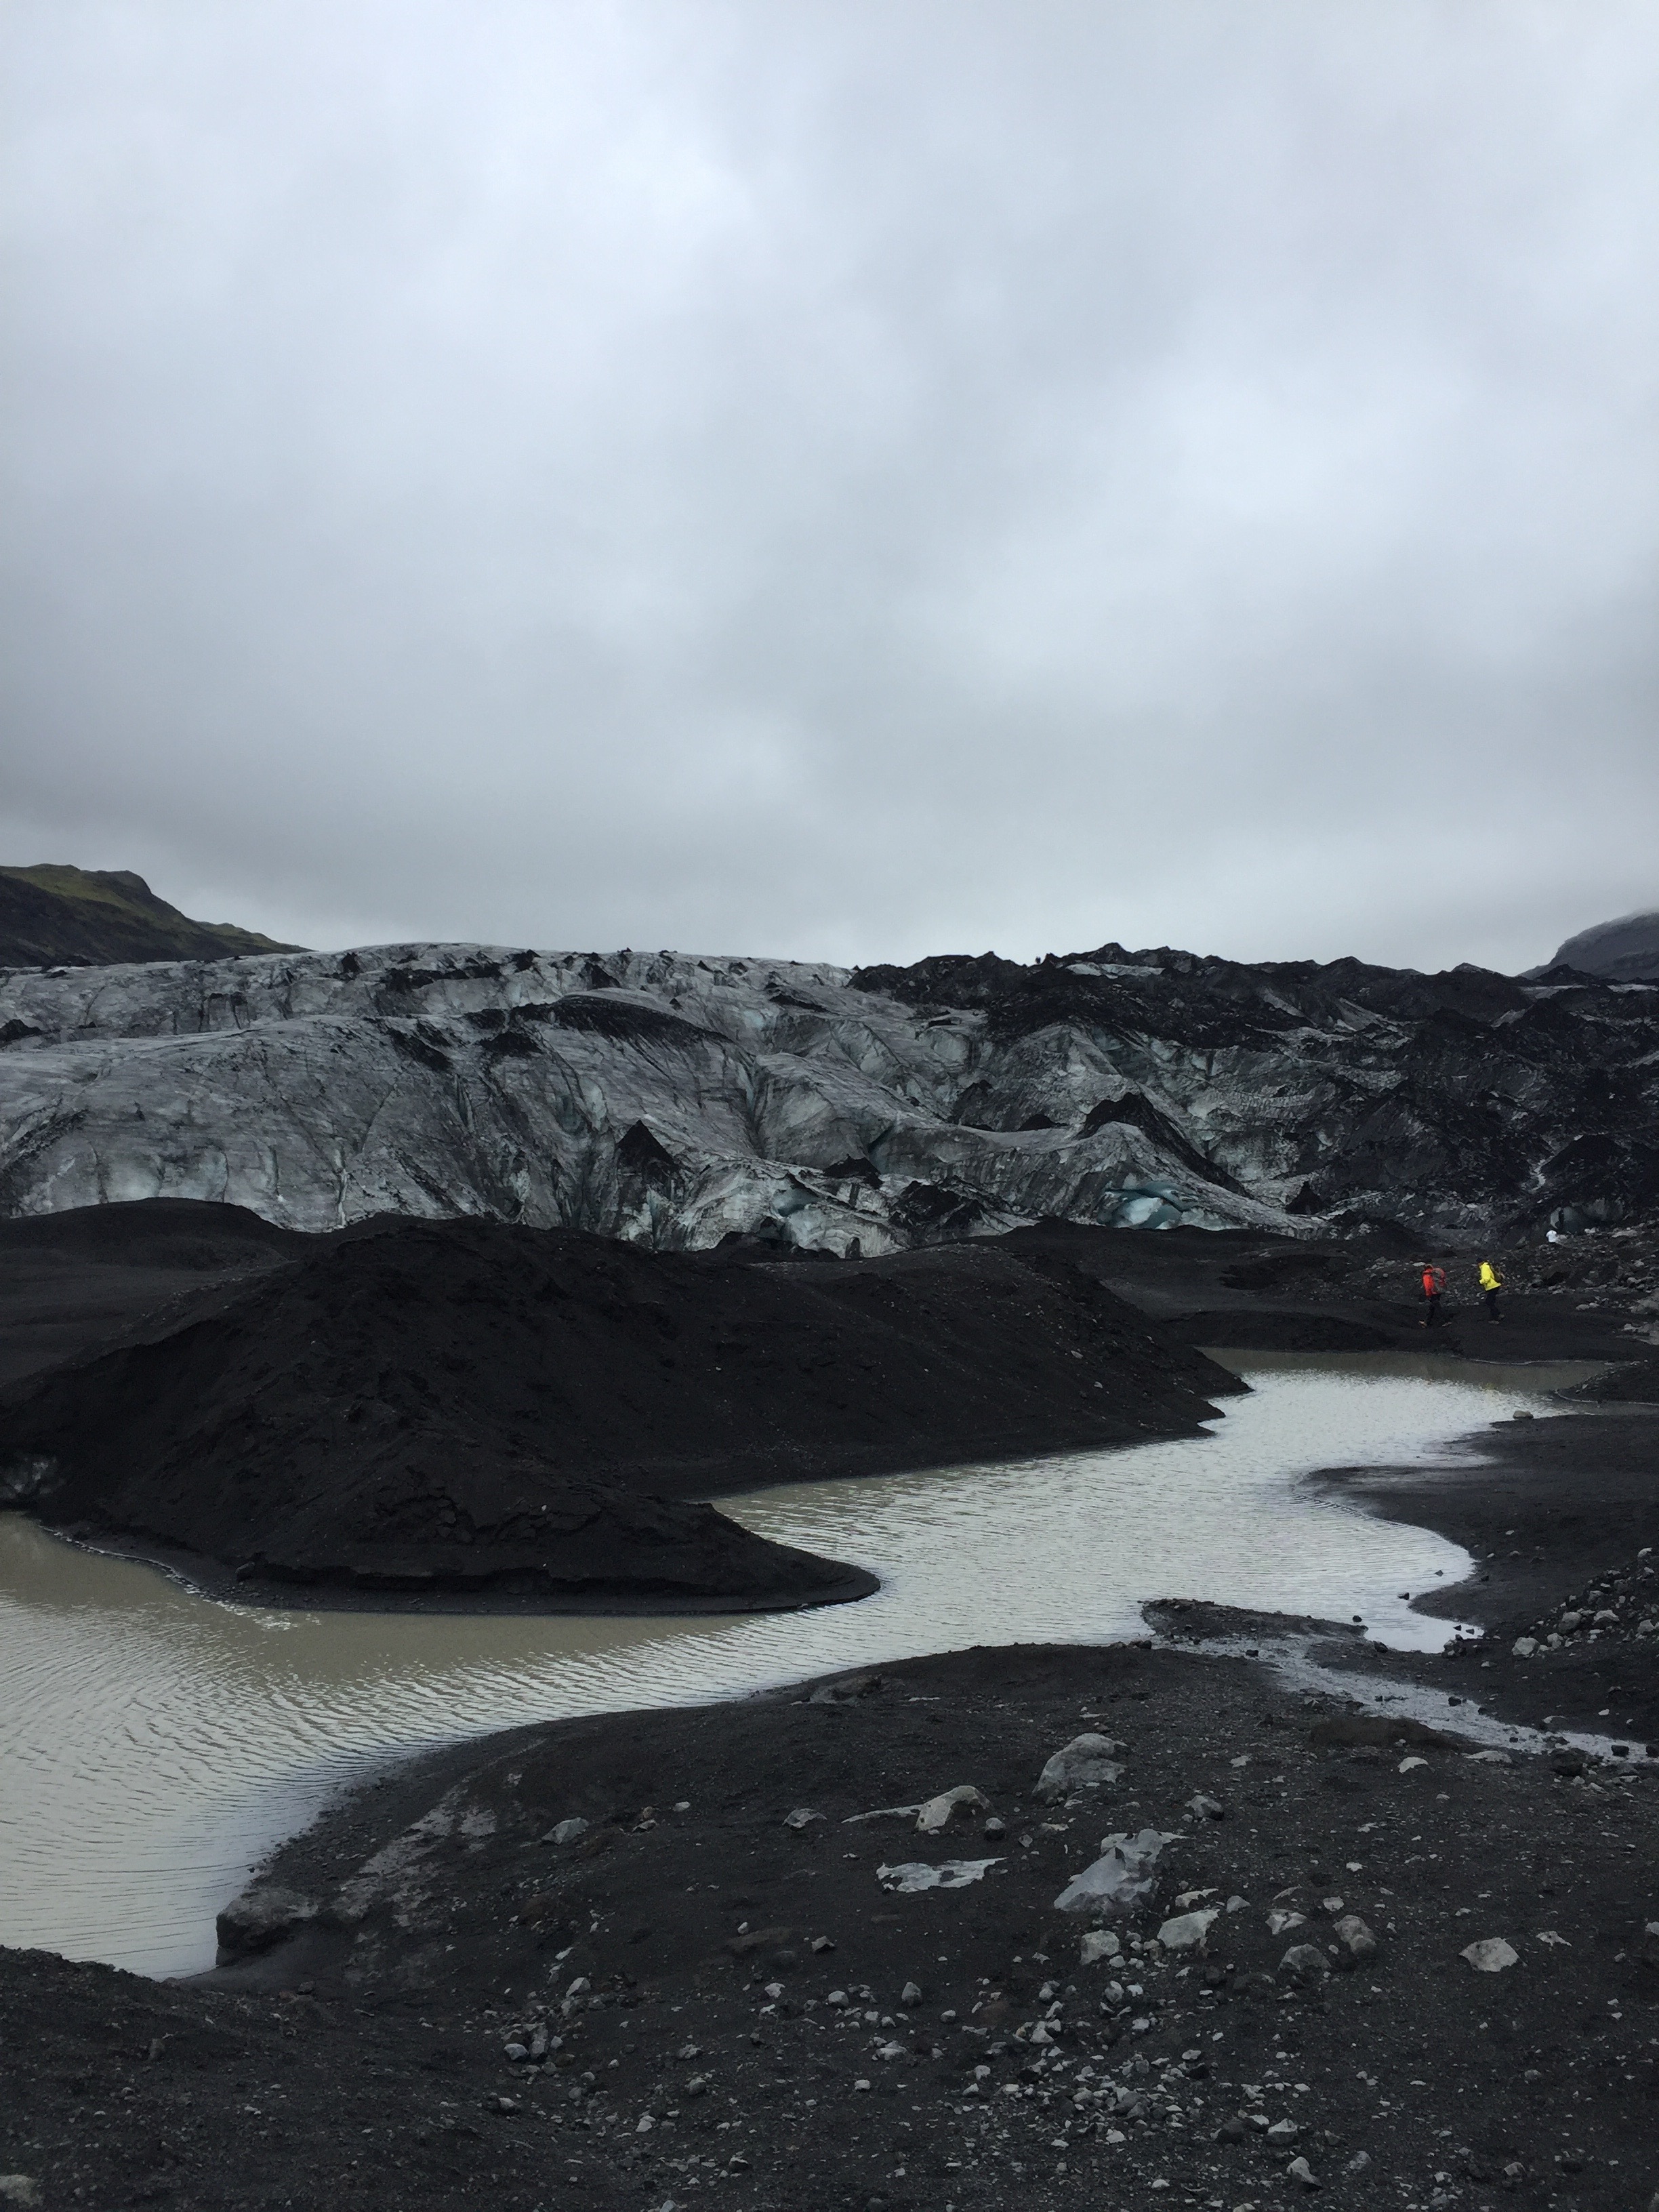
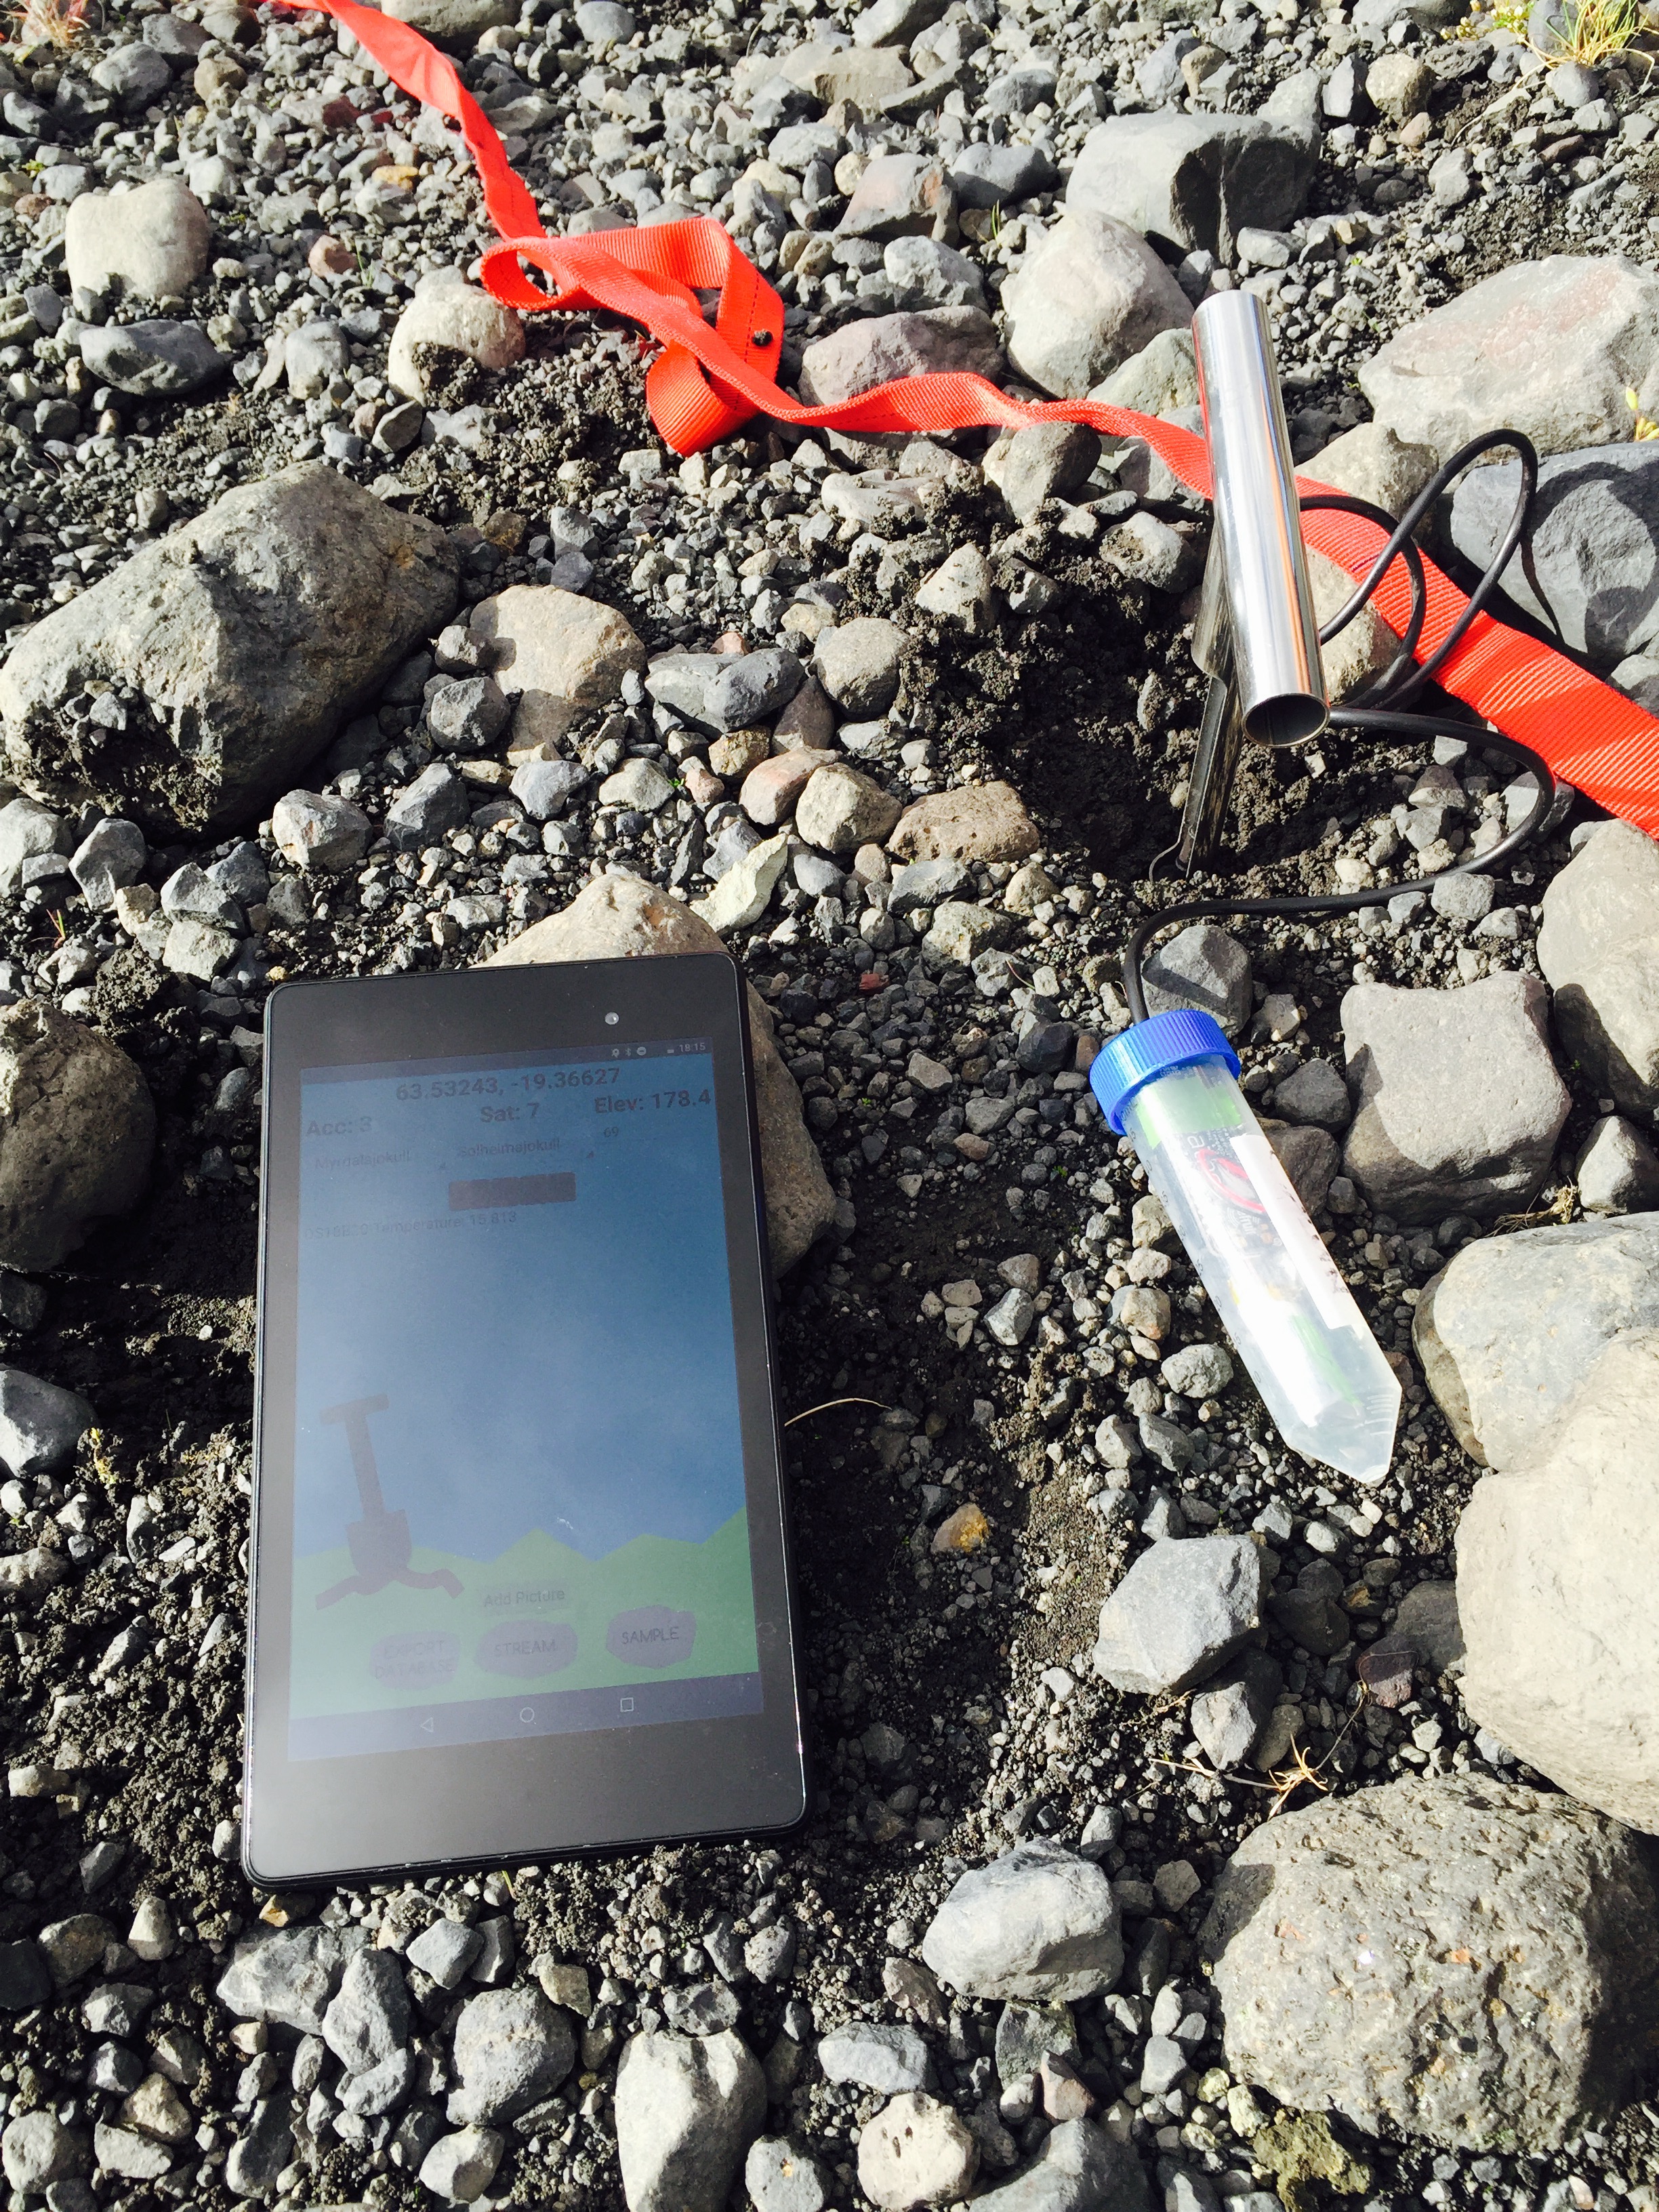
On June 28th we visited a small finger of Mýrdalsjökull (“mire valley glacier”) called Solheimajokull. Our goal was to stream accurate elevation data from our ambiance platforms in order to approximate the extent of the glacial finger. If our data comes out as we hope, we can combine it with existing datasets to approximate the volume of Solheimajokull. We were able to walk reasonably far up the glacier as well as to each edge, so we are hopeful that the volume calculation will be possible.


IMG_1700
Approaching Solheimajokull through the runoff from the glacial recession


On Wednesday June 29th our group bifurcated for the day to take care of two separate tasks. One group returned to Solheimajokull to take soil samples in the glacial forefield and the other stayed at the airbnb to work on platform reliability at data visualization.

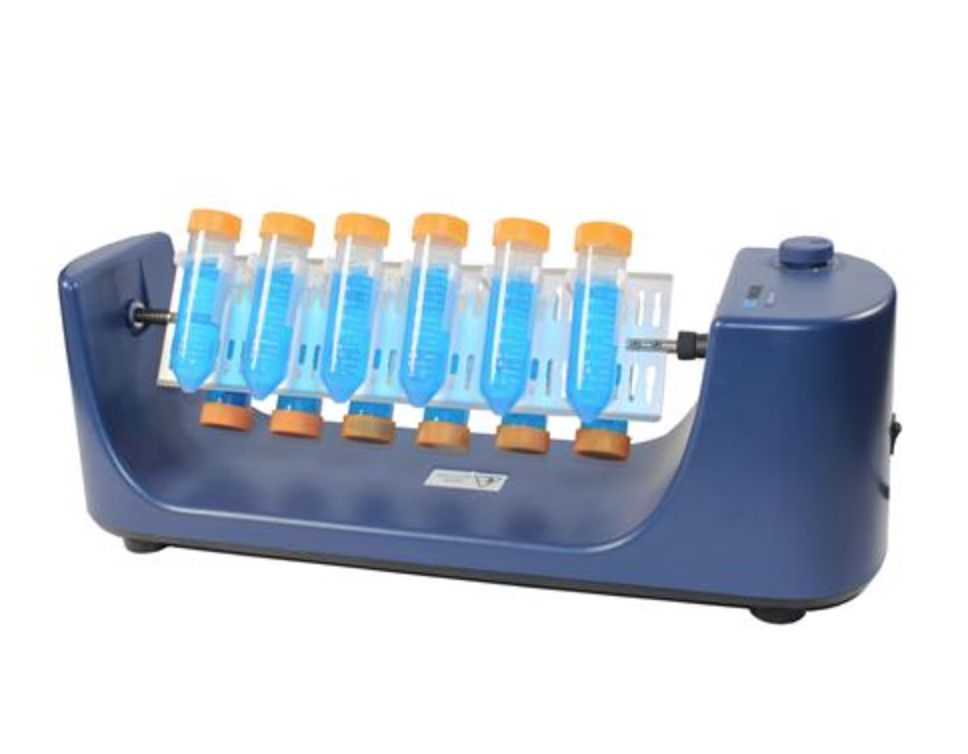
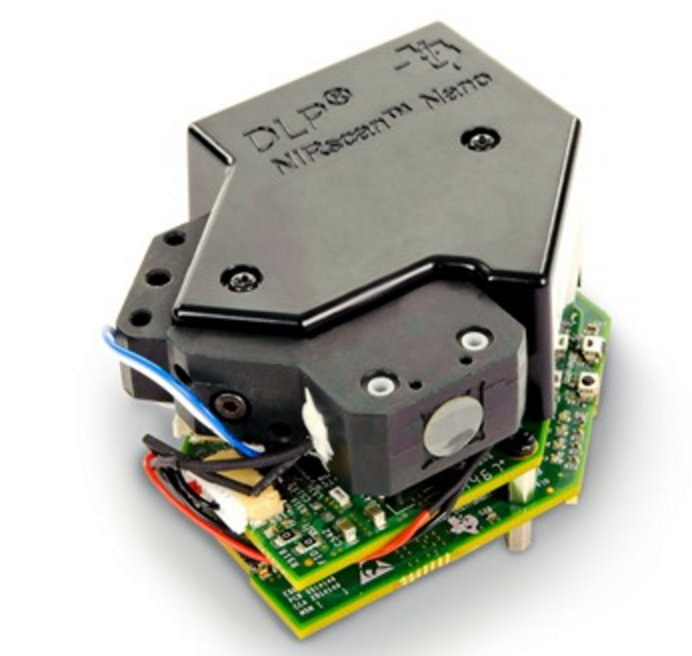
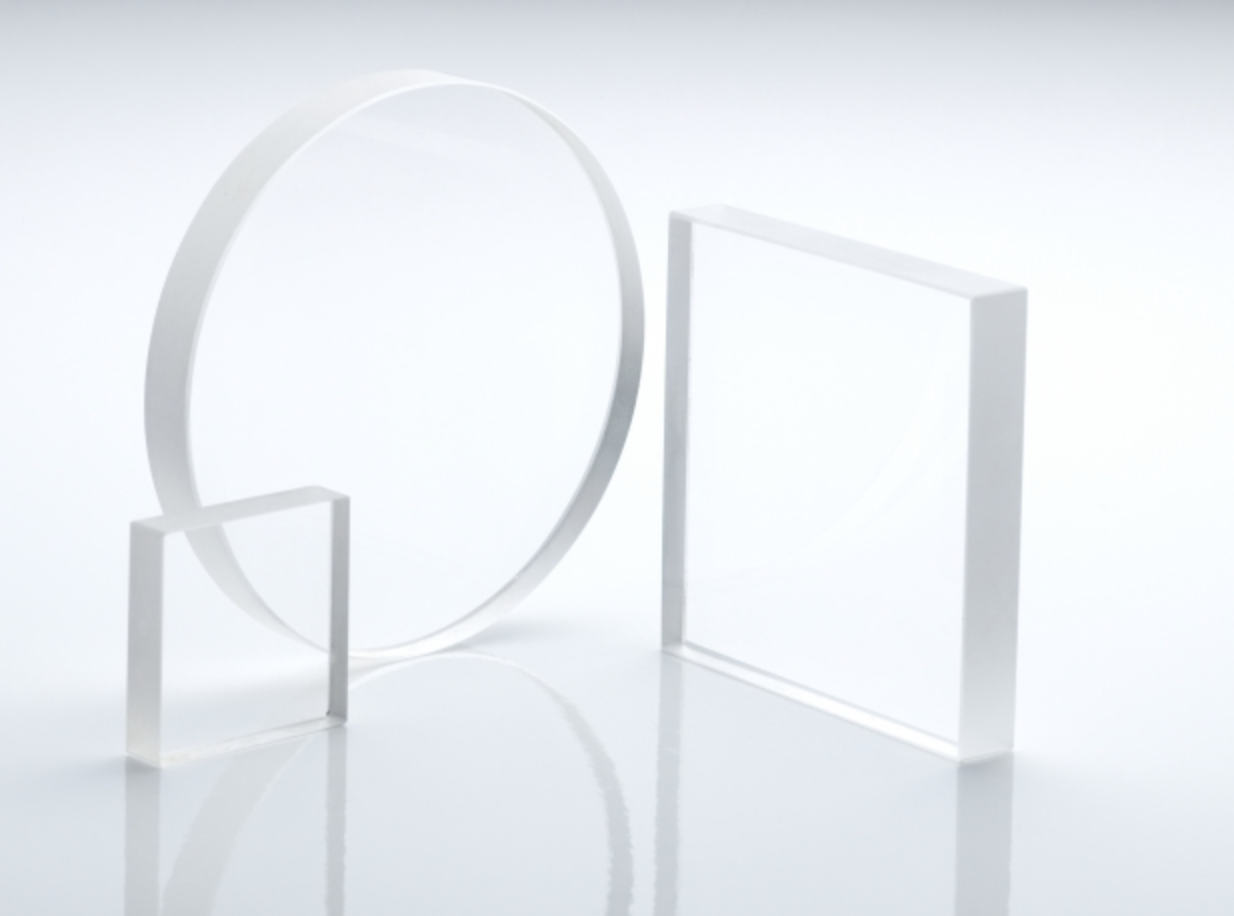
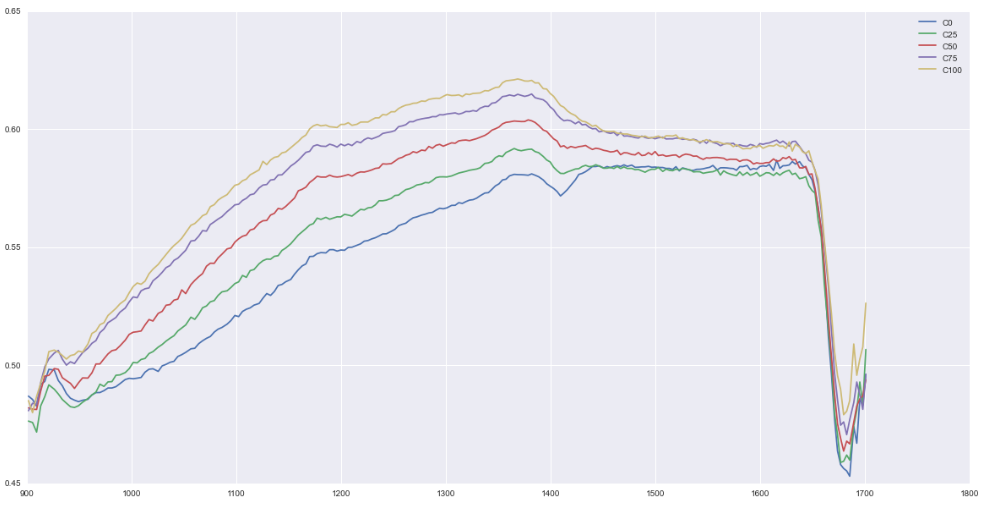
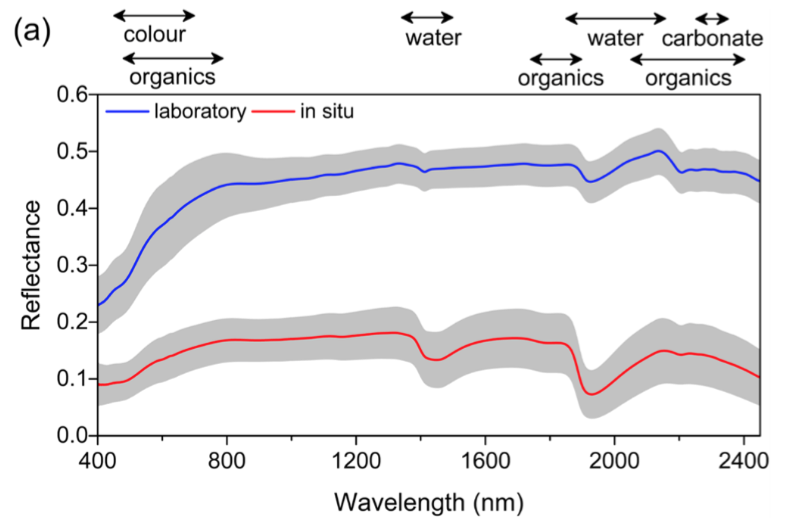
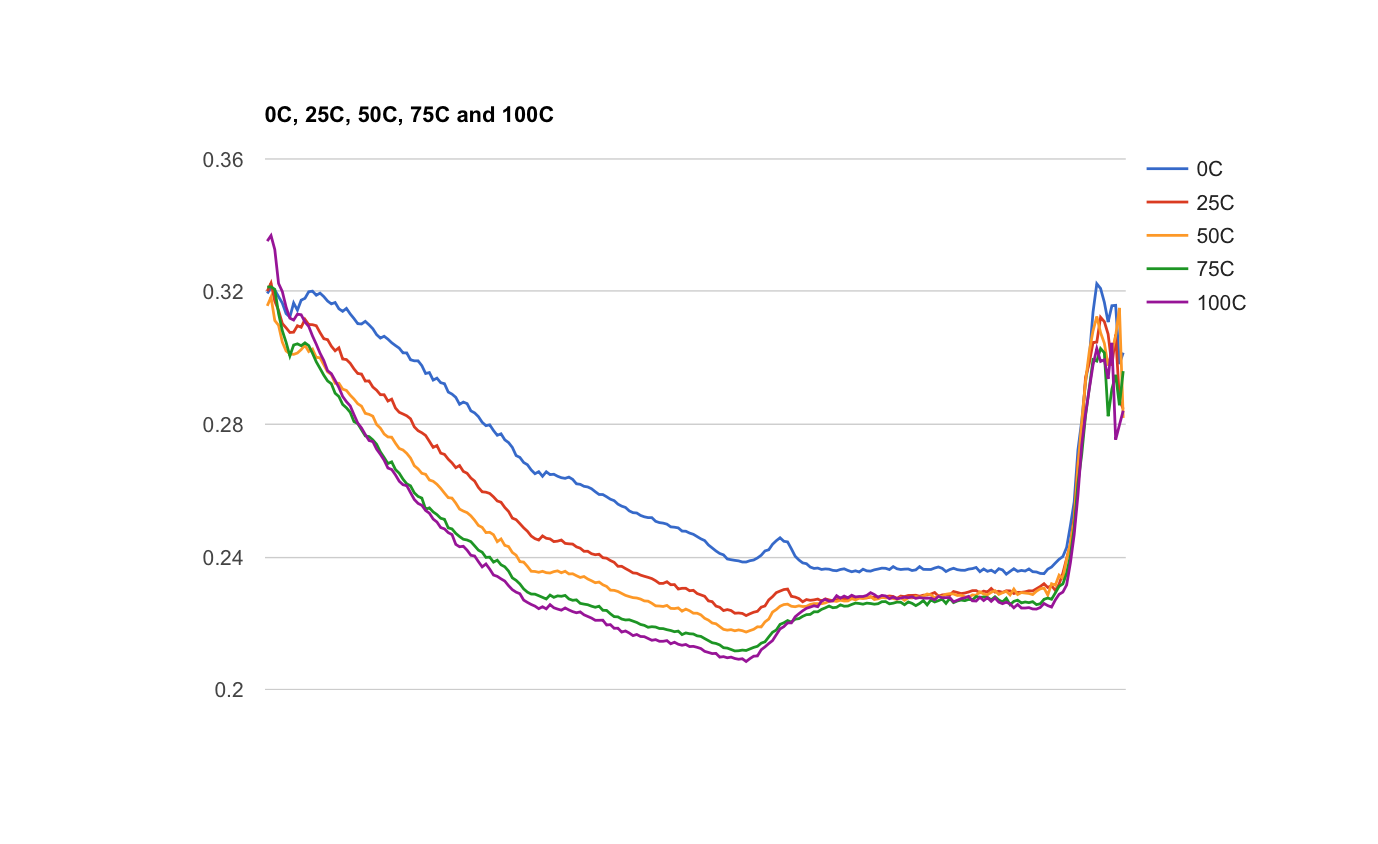
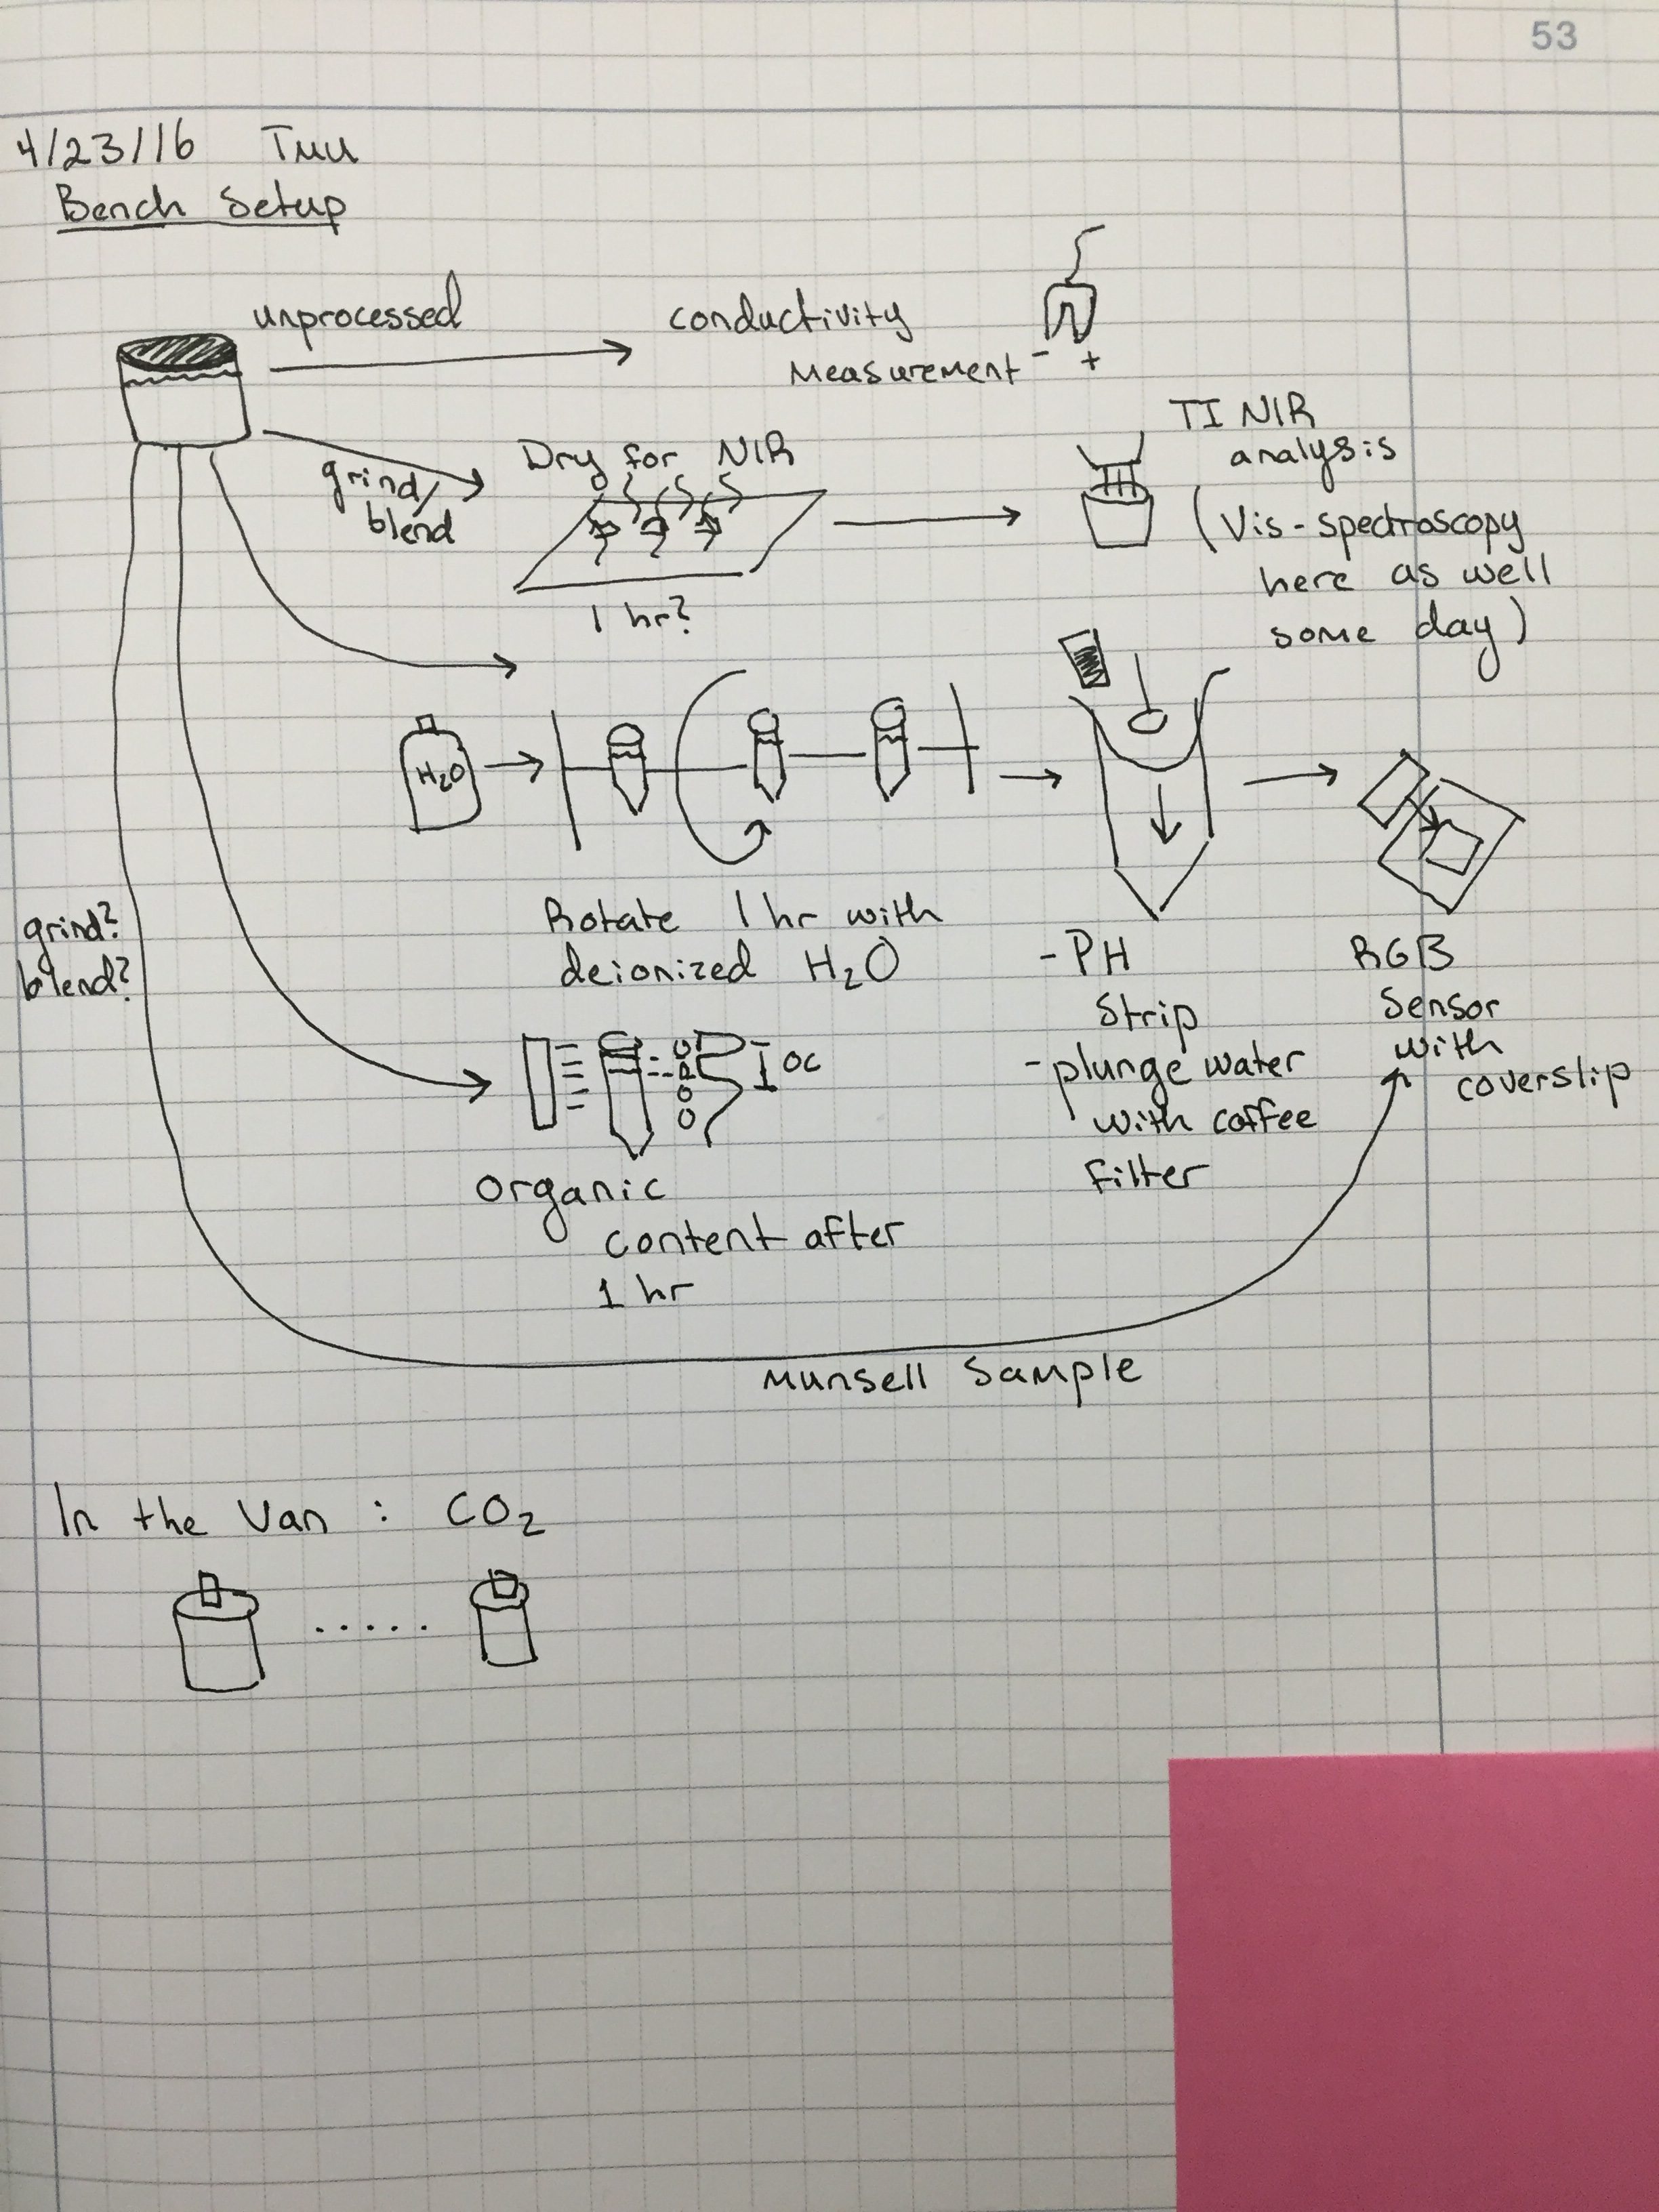
The forefield represents a chronosequence in which the soil has developed as the glacier recedes. Our goal is to observe how soil composition varies with age. While sampling, we observed changes in the smell and texture of the soil as well as increasing plant growth as we got farther from the glacier. In the evening we separated out rocks from the soil and carried out NPK (nitrogen, potassium, and phosphorous) testing on the first few samples. In other words, we sat around our kitchen table and shook dirt in tubes for a few hours. In the next few days we will test the remainder of the soil samples as well as characterize the carbon concentration in the soil using NIR spectroscopy.


IMG_1746
Using our temperature probe ‘Calvin’ in the glacial forefield


On the 30th we traveled east, making two notable stops. The first was at Grafarkirkja, a river at which the tephra layers created by volcanic eruptions are visible. We took samples from the six topmost layers. Our goal is to identify the eruption of Laki based on the unique chemical signature of its ash. The ash produced in the eruption of Laki had unusually high levels of fluorine. With this information we should be able to distinguish Laki’s tephra layer from the other layers.

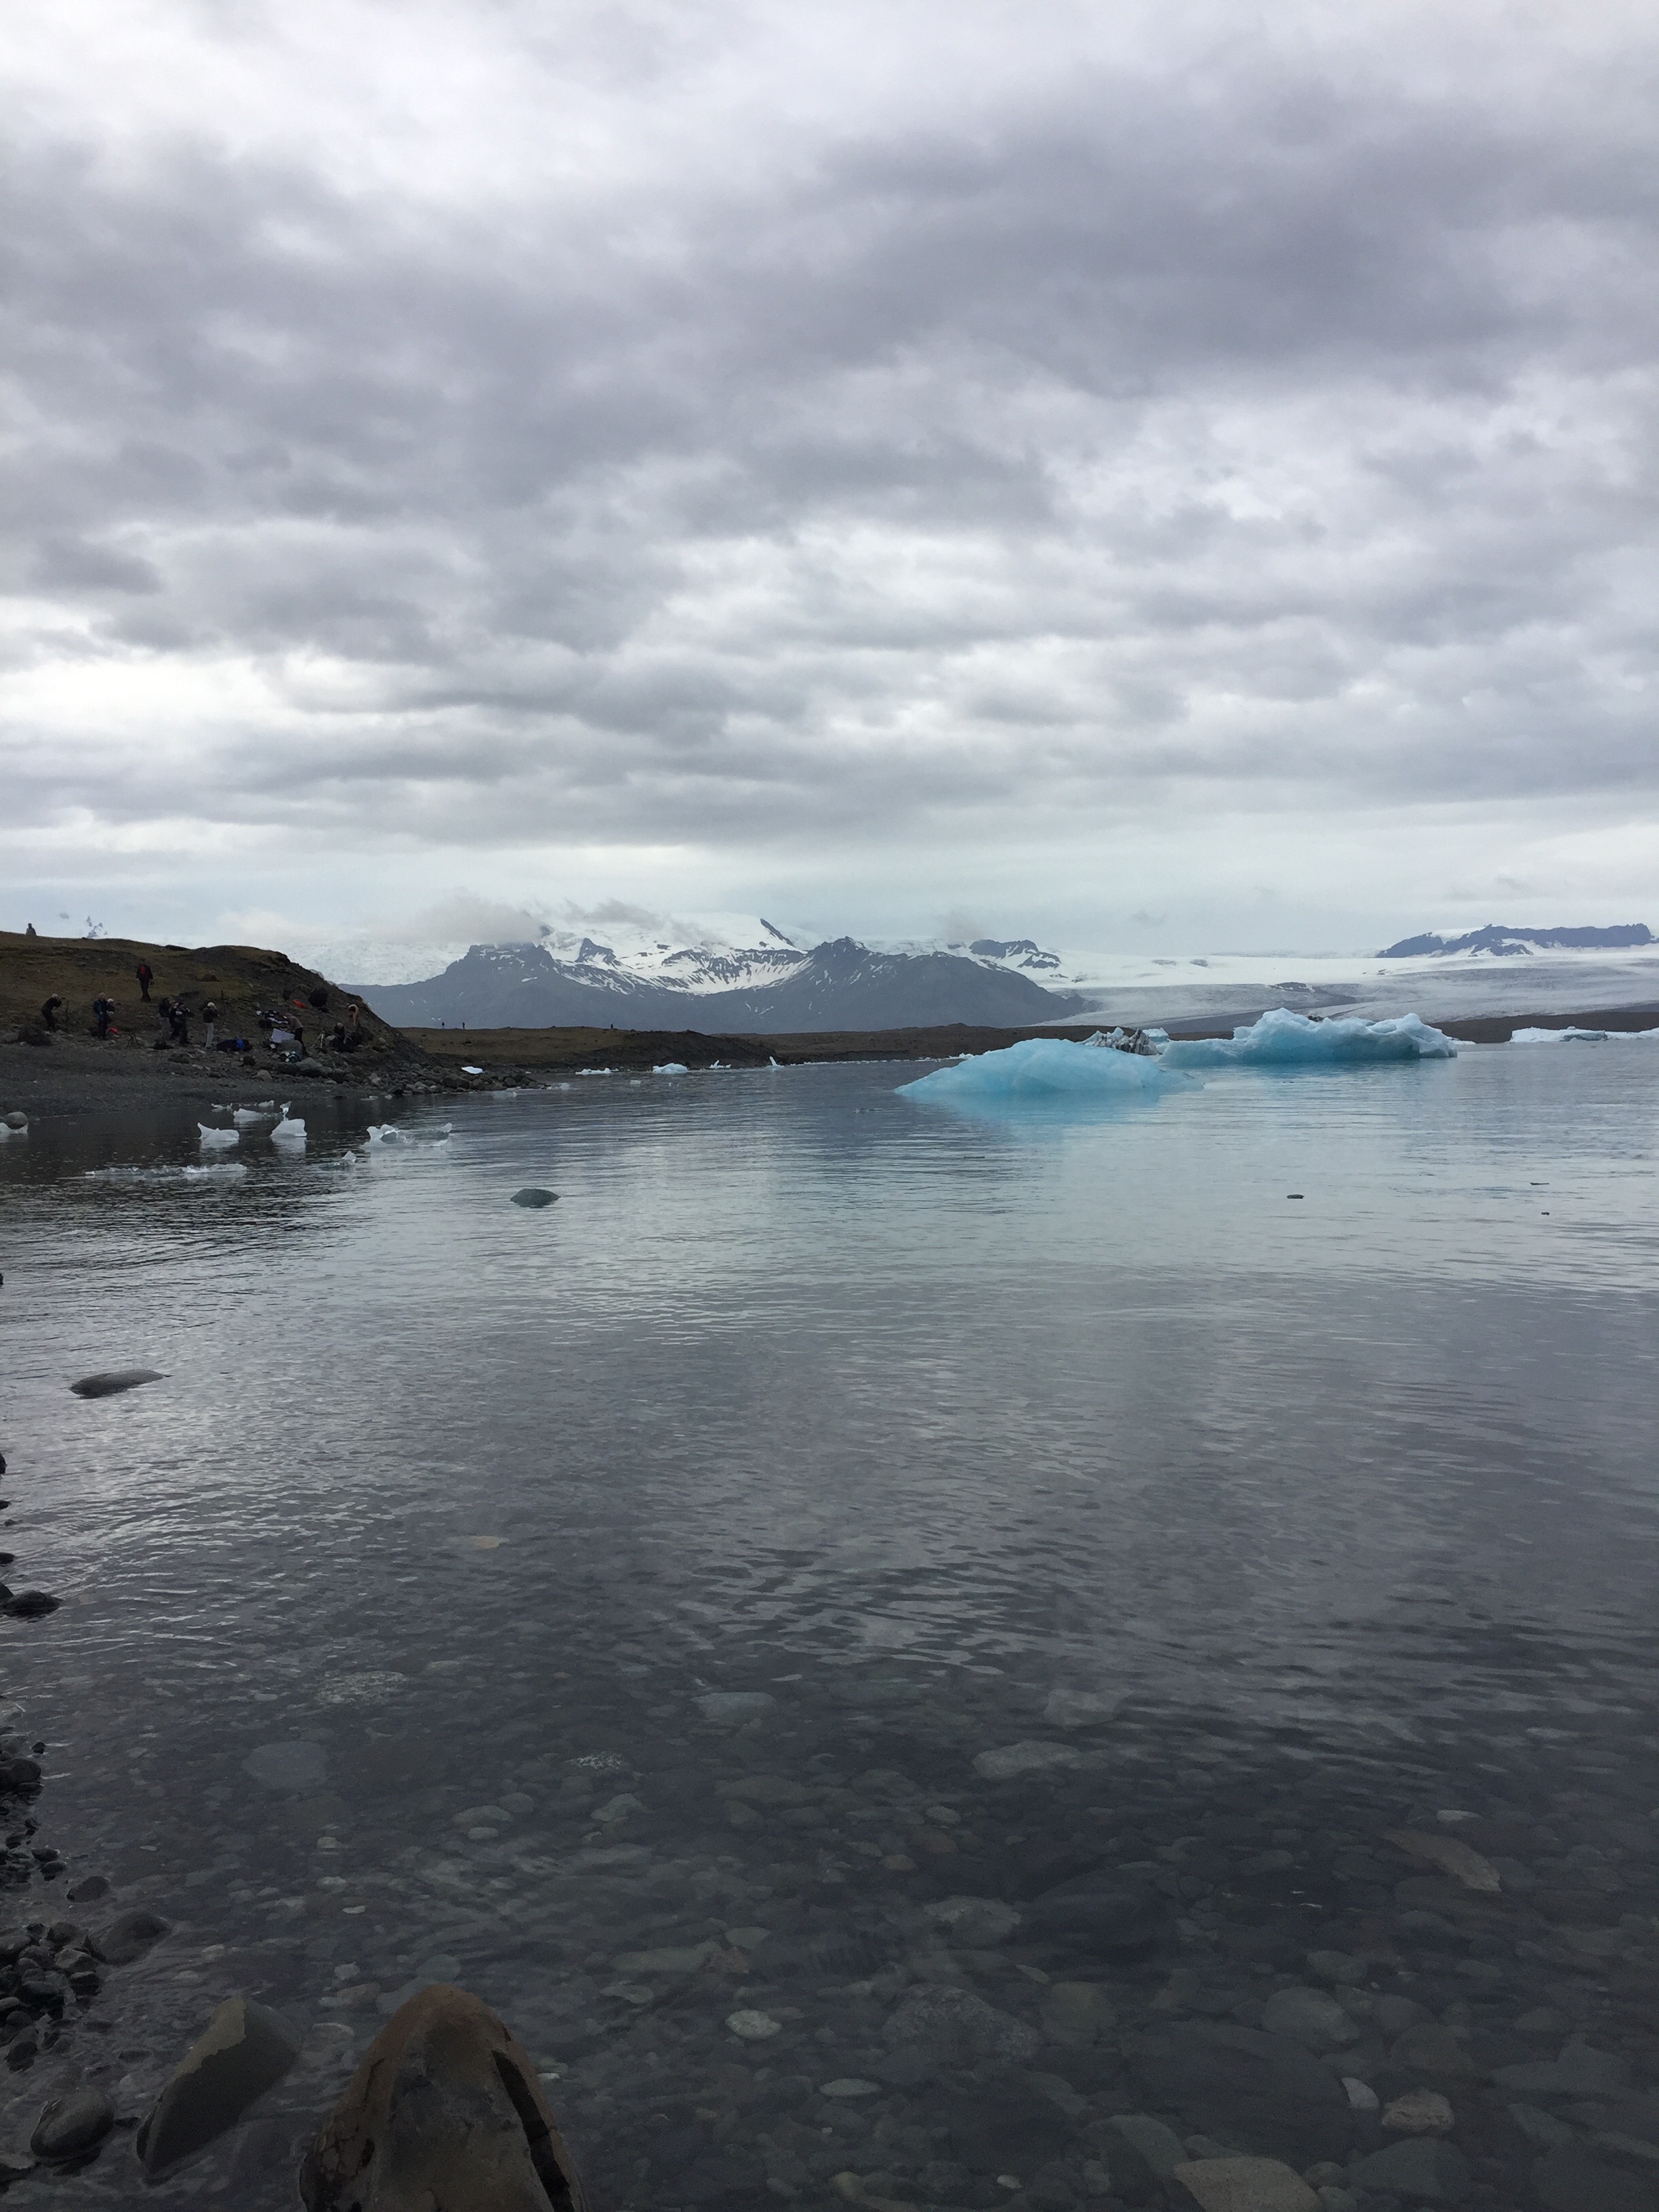
Our second stop was at the picturesque ‘Glacier Lagoon’, which is fed by Iceland’s largest glacier Vatnajökull. Large chunks of ice can be seen floating in the water. Charlie observed that there are fewer ice chunks than in 2014 and that the heavy recession of Vatnajökull is apparent across the lagoon.


IMG_1765
Glacier Lagoon


Today we arrived at Skálanes and have begun setting up our gear for carrying out soil analysis. At Skálanes we will conduct surveys of the nearby archeological site using our UAV and LiDAR platform. We are also interested in surveying local bird and fox populations using the UAV. All of the geocoded images and data we record will contribute to our goal of orienting our results using QGIS. We will also take soil samples from the gardens here to determine the its composition.

Blog 6/28/16

with No Comments

Today we started our ascent of Helgafell at 8am. The hike up was much quicker than Eldfell and the weather was clear so we had an amazing view at the top. We recorded GPS data starting at sea level all the way to the top of the peak. After hiking Helgafell we stopped in the town and had a quick lunch at a restaurant called Gött. Several of us tried the fish of the day, and at the risk of fulfilling every travel stereotype, a food picture is attached.

After our meal we caught the ferry to the mainland. We reunited with our vehicle and then embarked on a one and a half hour car ride through Vík to our Airbnb in Kirkjubæjarklaustur. We stopped at the Black Sand Beach near Vík and treated ourselves to coffee at Svarta Fjaran before going down to the water. Instead of sand the beach was covered in darks stones smoothed to perfection by years of weathering. The beach also has a unique basalt formation called columnar basalt, which is caused by lava cracking as it cools. A few of us took an unplanned wade in the seawater when the tide rushed in unexpectedly. Luckily we were only meters from fresh socks.

We are preparing to sample on the Glacier tomorrow afternoon. In the morning we will journey to downtown to procure distilled water for our soil protocols as well as groceries.


IMG_1676
Black Sand Beach was beautiful and overcast.
FullSizeRender
Delicious ´fish of the day´

Building Device Housing and Bench Tools

with No Comments

Each device I am prototyping for bench or field work needs some kind of housing so that it can serve its purpose and/or stay operational in wet or dirty situations. There are three  I am focusing on now:

  1. Bench top flacon tube spinner. Originally inspired by this device that costs $100+, the bench spinner is necessary for measuring accurate pH of soil. Charlie and I have come up with a device that can spin up to 10 falcon tubes at a time and will be made from PVC pipe, epoxy, and potentially a lego  motor.
    Screen Shot 2016-03-23 at 10.49.19 AM
  2. Field sensor case. Modeled off of the 3D printed ‘flask’ design previously used in Iceland. The case will be larger to house a BLE shield and will have a hole with some kind of cover to protect the IR temp sensor (working with BLE). Right now I am trying to figure out if the soil moisture/temp probe (not working right now, may be toast) and the conductivity probe (working) really need to be out in the field or if the same data can be gathered on the bench. Once everything is working and in some kind of preliminary housing I can test that.IMG_1558
  3. NIR TI Nano housing. We have just purchased two quartz crystal coverslips that transmit NIR radiation. I want to build one of these into the housing for the nano so that the internal optics as well as the micro controller are protected. The coverslip is about the size and thickness of a quarter. It is important that it is completely flush with the Nano optics and that it can be lowered completely onto the sample so that the distance between the optics and the sample is not only minimized but uniform. Until the quartz slips arrive I have stalled testing and calibration of the nano to protect it.


Screen Shot 2016-03-28 at 10.12.43 AM

Screen Shot 2016-05-27 at 10.13.00 AM


Two other things that are temporarily on the back burner but are still important:

  1. The CO2 probe. If it works, this probe would allow us to measure CO2 respiration as a proxy for microbial biomass. Charlie had the excellent idea of attaching the probe to one end of a long PVC pipe full of soil, to increase our sample size and not disturb the microbes by digging up and mixing their soil habitat.
  2. The RGB Munsell color sensor. I have started experimenting with colors the RGB reads and have so far been a little disappointed by it’s accuracy. I will work on compensating for ambient light and optimizing the reading in one color space before using a linear transformation to convert those values to Munsell space.

Two final ideas are on the lowest priority in the ‘if I have time before we leave’ category. They are:

  1. Bench-top light-transmission organic content. A fancy name for shining light through a tube and measuring the thickness of an organic content band. This would be cool because it’s automated but it is easy to do visually and might even be more accurate, so it’s not a high priority.
  2. RGB pH strip measurements. This one is also easy to do by sight, it isn’t difficult to match the color of a pH strip to a key. However, once the Munsell color platform works, adding this functionality is simply a matter of writing the software, because the hardware setup is the same. For that reason it is more likely to be completed then the OC reader, which is somewhat design intensive.

NIR Reflectance

with No Comments

This past week I mostly worked on NIR, the field platform, and a little on the CO2 sensor.

I converted the collected absorbance data from the TI Nano to reflectance, which is better documented for organic content. I reran standards that are a mix of sandy soil with very little organic carbon and compost, which is very high in organic carbon. These are the results:

Screen Shot 2016-05-23 at 10.53.41 AM

For reference, this is a figure from Shuo Li et al. [1]

Screen Shot 2016-05-17 at 3.57.26 PM


I would really like if the nice peak between 1300-1400 was our organics peak, but I suspect we actually want to focus on the scraggly region out by 1700. My plan is to focus in on this region and increase the sampling rate of the device. The trend here is very promising.

The field platform prototype is coming along. I have incorporated the BLE and Field Day-friendly formatting, but I am getting readings that don’t make sense. This week I will focus more on hardware debugging.

The RGB platform is my next order of business. I am going to start with Munsell color. That will give me a good jumping off point for less crucial things like pH and NPK strip analysis.

[1] OrganicCarbonTibet

NIR Progress

with No Comments

Stephanie and I have concluded our work making calibration standards with the FTIR. You can read about the work here: Soil_Paper.

The soil NIR platform is coming along very well. I have been taking spectra in the 900-1700nm region on the same samples we used to make FTIR standards. So far I am getting promising results.Screen Shot 2016-05-16 at 9.03.47 AM

The x-axis here is wavelength and the y-axis is absorbance. These results are exciting to me because I see a clear gradient in absorbance between samples with different percentages of organic carbon. They are puzzling because I would expect to see the trend reversed, with 0% carbon absorbing less radiation. I am not entirely sure what I am seeing here yet, but these results at least confirm the sensitivity of the IR platform to relatively small variances in organic carbon. Sensitivity will be favorable in the context of Icelandic soil because it is mostly composed of andosols, which are under 25% carbon. The next steps are to rerun these standards, run a few standards that should be 0% organic C but are of a different chemical composition, and run samples with %C between 0-25%.

I have also been working a lot on the field probe. I need to do a quick field test to determine how important it is that soil conductivity and moisture content measurements are taken in the field vs. on the bench. Right now the field platform includes an IR temperature sensor, a moisture content sensor, and a conductivity sensor. I am currently debugging the existing Arduino code for this platform to be compatible with a different sensor pinout.

This past week Charlie and I discussed the sample plan for the glacier. Using what we have learned from recently published resources on glacial chronosequencing, and troubles with the sampling location in 2014, we think we have a rough plan for how to sample on the southernmost glacier.

TI Nano works // Bench plan

with No Comments

This week, with help from Charlie, I got the TI Nano near-IR scanner working well on the bench. We can now scan the same samples we have been benchmarking with the FTIR so we will have good calibration curves to compare with our field samples.

I have also been working on the bench plan in general. The workflow I have come up with is below:

IMG_1240

Iceland Soil Standards

with No Comments

This past week I was able to use a small sample of the aDNA samples to take an IR profile of Icelandic soil. I was really excited to see a small peak in the part of the spectra we have been focusing on for characterizing organic content. Using the calibration curves we have developed, we were able to calculate that the soil has around 24% organic composition. That is on the higher side of what we would except to see for Icelandic soil, but makes sense given the location of the archeological site.

The next steps will be to run the same standards with the DLP Nano. The Nano covers a much shorter wavelength portion of the IR spectrum, the near-IR. We will not be able to observe the same peaks we can see with the FTIR, but hopefully we will identify others, and can ‘stitch together’ the near and mid regions. One day it would be nice to develop a cheap, arduino-controlled visible light spectra so we can cover the whole visible-to-mid IR region of the EM spectrum. I’ve looked into the design of the vis spec and I think we could do it with a sony barcode scanner and a few lenses. Dreams for the future!

I haven’t had much time to physically work on the soil platforms in the last week, but I have worked out some more of the conceptual kinks around the workflow. I feel really confident that we can do everything we want to do in terms of collecting soil metadata, now it’s just a matter of putting all the pieces together.

One piece that has just been added to the picture is using CO2 measurements as a proxy for microbial life. This would be particularly useful for the glacial forefield (a prime site for dna extractions in the future). I will be reaching out to Chris Smith for advice about how to maintain the samples while CO2 is measured.

Iceland Soil

with No Comments

This week I have been mostly working on accessing Iceland soil in the ancient DNA lab. The soil was shipped back from Iceland after the trip in 2014. It currently lives in the ancient lab because eventually DNA will be extracted and specific mammalian DNA with specific markers (Horse and a few others) will be amplified. The goal will be to determine what animals were cultivated in the ancient human settlement formerly at the site where the samples were taken.

Today I will follow the sterile lab protocols to take out a very small sample of the soil and bring it to the analytical chem lab to be dried out in an oven, removing all living microbes. The remaining sample will still be usable for DNA extraction, and there will be more than enough left for multiple extractions.

Other than soil, I’m working on using openSCAD to design housing for the sensors that we will 3D print. My first priority is a housing for the TI Nano, followed by the field platform. The Nano needs a case so we can change its orientation 180 degrees and take soil spectra. I would like to get this working soon.

I am making progress on all of the sensor platforms. Kristin has been making a lot of progress on BLE so the sensors should be integrated with Field Day and ready for testing soon.

Spectroscopy and Sensor Platforms

with No Comments

Since my last blog post a very long time ago a lot has happened. Here is a breakdown by platform and by sensor:

Near IR spectroscopy: the rise and fall of the SCIO

At the time of my last post, I was eagerly awaiting the arrival of the SCIO. The machine itself was something of a disappointment. Under the hood it’s basically a tricked out CCD camera. The raw data is also completely closed. This was kind of a disappointing realization, but we rallied. Instead I am planning to try out Texas Instrument’s DLP (R) NIRscan (TM) Nano. It’s a bare bones, open source spectroscopy platform that covers an impressive 900-1700 nm range. In the meantime, Stephanie, Mike and I have been developing calibration curves for the Nano with the FTIR. The results thus far have been very promising – we have identified a peak in the IR spectrum that varies almost linearly with organic content concentration. We are also planning to take spectral data from Icelandic soil samples currently residing in Heather’s ancient DNA lab. We will follow sterile protocol and remove a small amount of soil for the FTIR scan.

I have also considered the idea of building a visible/NIR spectrometer. This would allow us to take spectral readings from the visible and IR ranges of the electromagnetic spectrum and cover more possible organic content peeks. The hardest part about building a spectrometer is not actually the optics but powering and reading the CCD. I have found a linear NIR CCD and possible arduino code for driving it, but I’m not sure if I will have time to optimize it before we leave, so I’m back burner-ing it for now until I progress more on color conversion and OC sensors.

Munsell Color and PH

Using an RGB sensor to get an approximation for Munsell color would save us time on comparison and data entry. A vis spectrometer could also corroborate Munsell color values, if I were to build one.

This week I have been learning a lot about color spaces. The RGB sensor takes values that live in RGB space. Munsell color space is a 3D space with axes (value, hue, chroma) that looks like this:

Munsell-Color-Solid-Plus-base-color-theory-300x2392000px-Munsell-system.svg


For Munsell color I have a table from RIT that converts MVH to XYZ, the colorspace bounded by spectral colors that describes colors the human eye observes, and the conversion to RGB from here is published. I will just be going backwards.

Screen Shot 2016-04-02 at 11.57.12 AM

For PH I am interested in color difference. I might be able to use XYZ like the Munsell, or I might use La*b* which is optimized for computing differences.

cie-lab


Field Sensor

The field sensor contains IR temp and soil moisture (and now i’m thinking conductivity as well). This is where I am trying to jump in with BLE. These sensors just need to pass an int or a tuple to field day. I am using a redbearlab BLE shield. The world of arduino is all pretty new to me and still confusing, but I’m making progress.

I am also jumping into openSCAD to re-design the field case to accommodate the BLE shield and IR sensor.


OC Meter

I gave up on the idea of building a scanning laser with a stepper motor. I think I can accomplish enough precision with an array of white LEDs, an array of photodetectors, and a black box. Redesigning now.


1 2 3