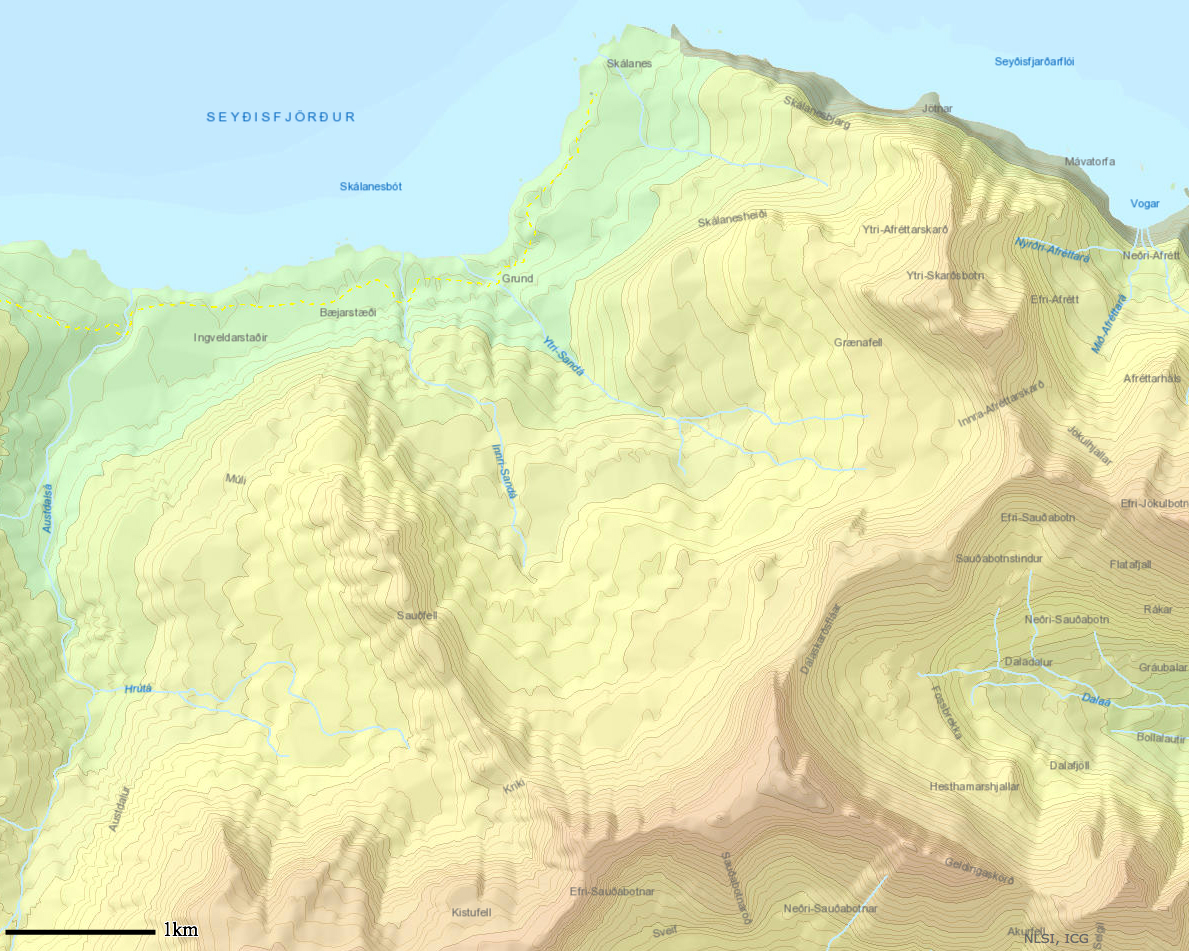
Charlie and Kristin gave me data from the last trip to Iceland on soil samples and the archaeology site. The data had XY coordinates in it so I was able to bring it into QGIS as a csv and visualize them on the map of skalanes. I did the same with the coordinates for the fox dens that Oli gave us. I was able to check with Oli, fix what needed to be fixed and confirm their locations.
I had a lot of communication with Anna from TREK Iceland this week. I confirmed with her what our needs and we finally have everything straitened out. I just need to hear back from her on prices and on a guide confirmation (I asked for Gummi however said that we are flexible if need be it would just be easier with him).
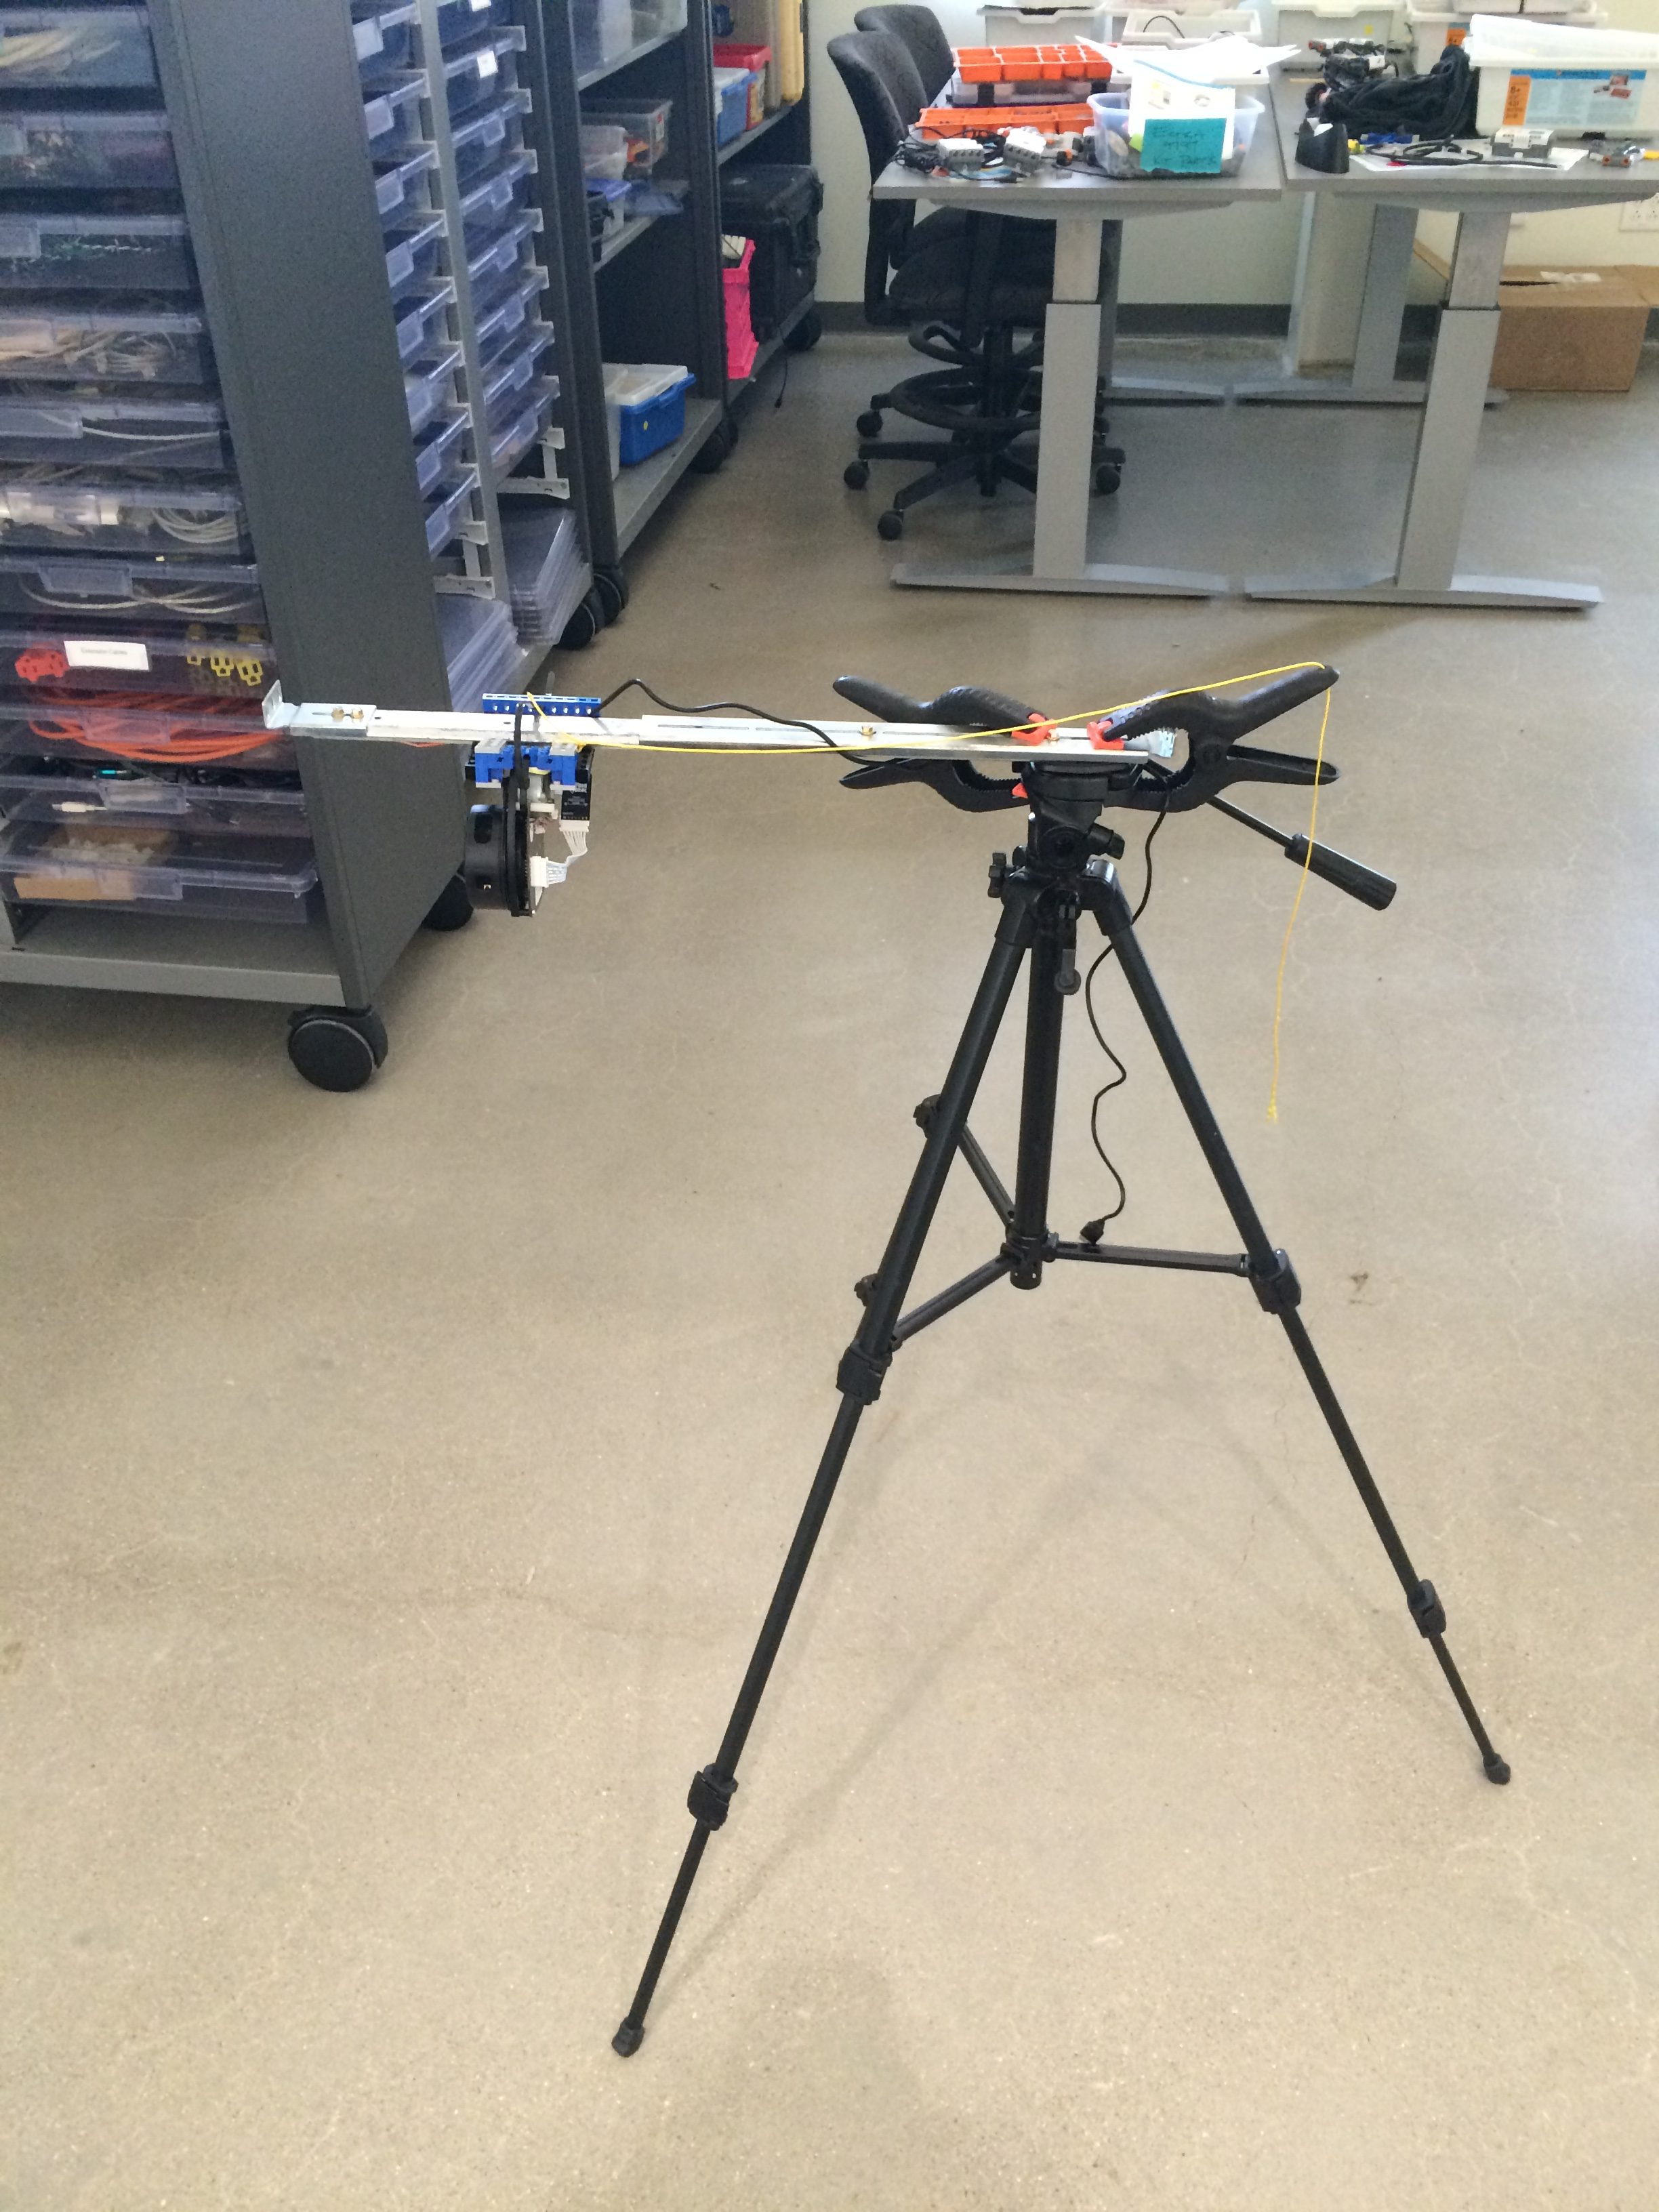
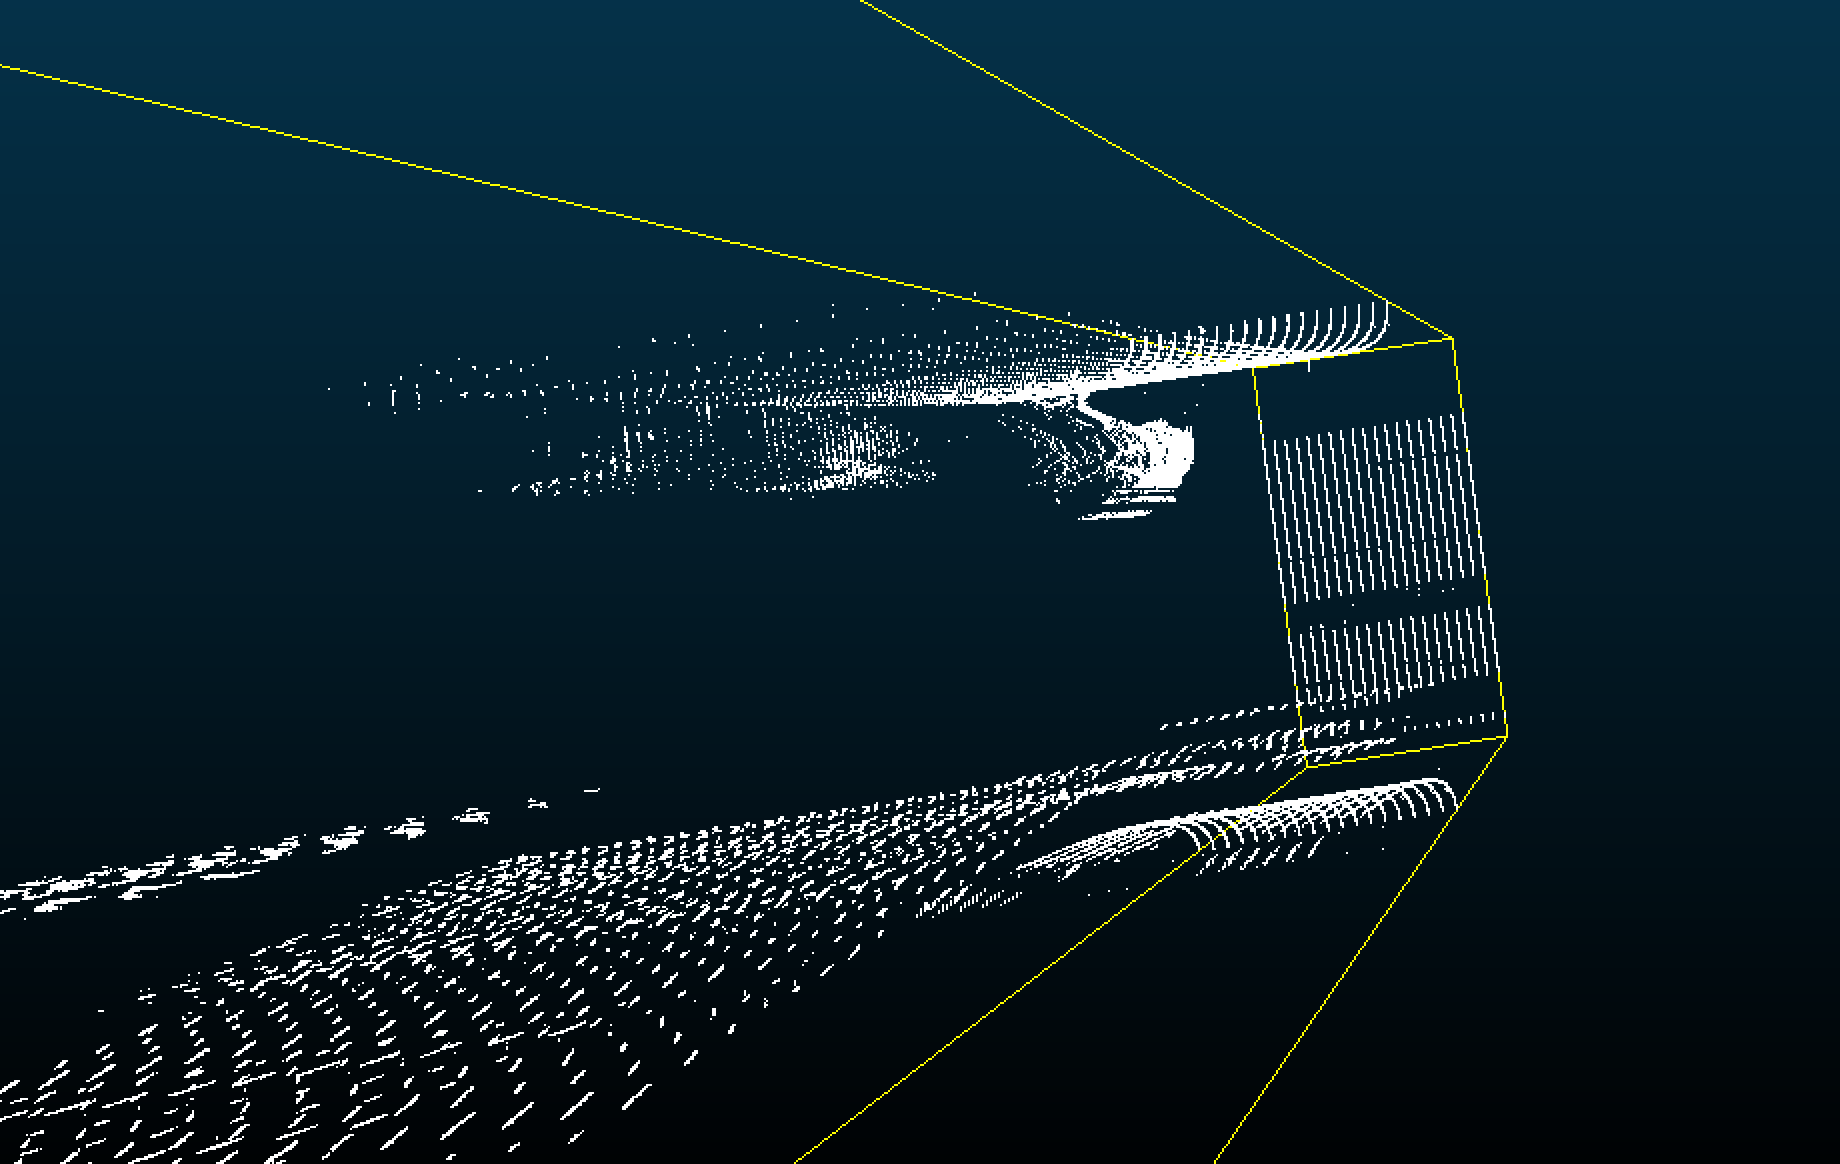
Next was a lot of work this week on stitching together photos taken by the drone. Nic and I went out quite a few times this week to both practice flying and getting pictures of the area at different heights. We took series of photographs from 10, 30 and 50 meters and I tried to stitch them together. Stitching them together is not very difficult when in reference to just each other because I just georeference points relative to points on other photos. The difficulty is placing them in relation to the world. I tried using google earth images to reference them but I am beginning to thing that taking a GPS point of known features in the area and using those as reference points may be more successful. I want to try this out this week.
This weekend I worked on installing QGIS onto the macbook going to Iceland and I brought over the map I have made so far. The only part we need to be careful about here is that any layer in a map you are using must be sourced to a place that that computer can access (eg. that computer). We can change the source but I had to individual make sure each layer was included separately when moving data over. Again pretty simple but it is good to be aware of and it takes a little bit more time.