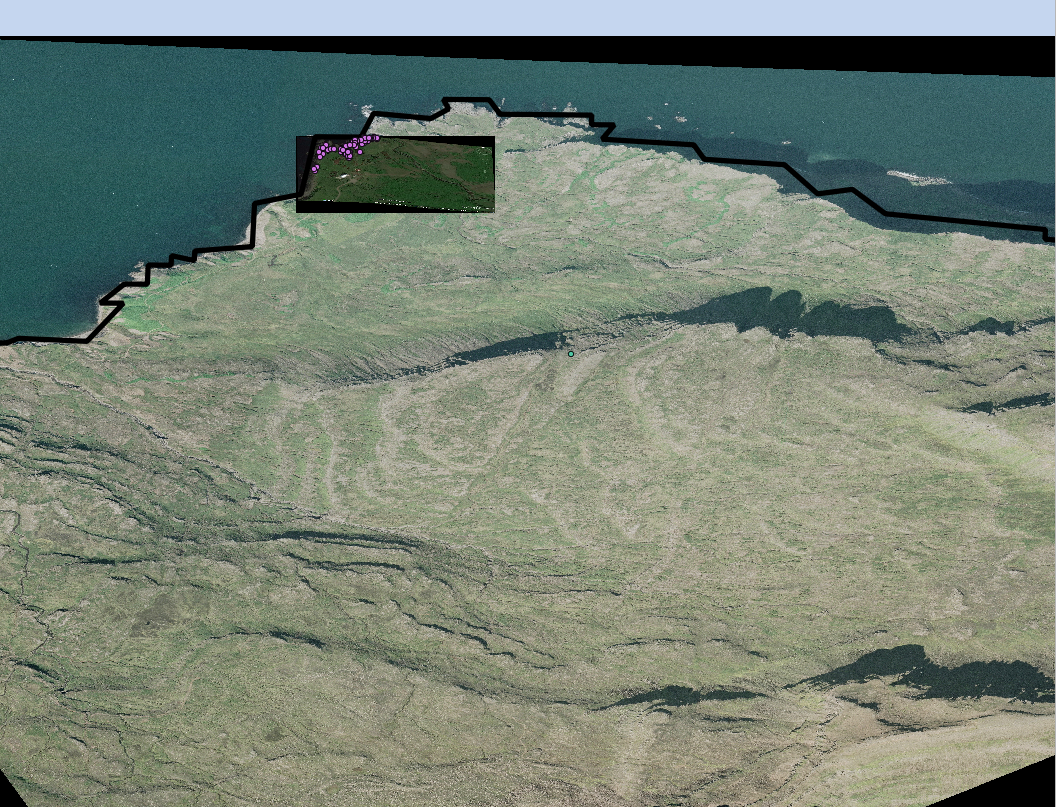
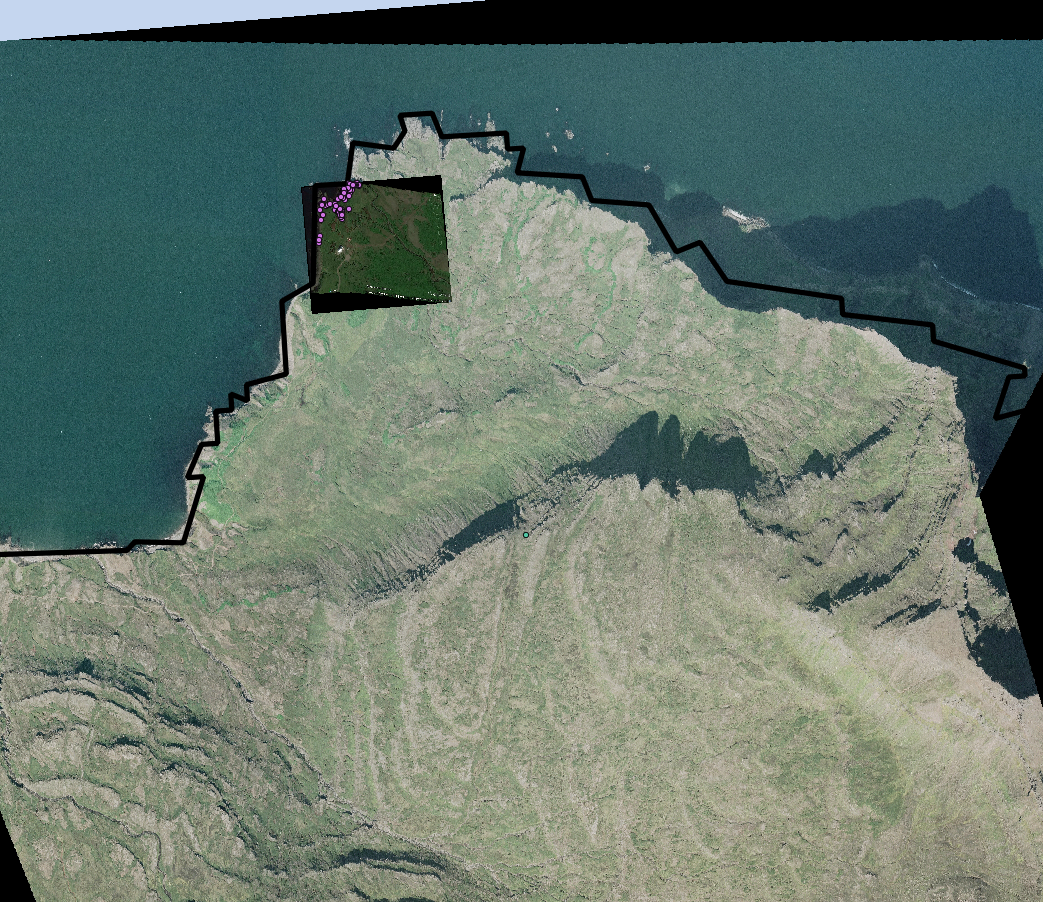
This past week, the new data model was implemented after some K,C and I talked about it for the past few weeks. We now have multiple tables in the model, with a table for basically every data point. I have been looking at Iceland 2014 data to figure out what data we can move over into this new model. I’ve learned that there isn’t very much data we’d like to move over from Iceland 2014, although almost all the Nicaragua data is good to move over (in the fall, once we’re back from the Iceland scrum.) The distance function came in really handy here, and made me really glad that we finally all have the old data in a single, easily searchable place. We’re not moving the data over into the new model, but it’s easy to query it where it is now (something that hasn’t been possible for a while)
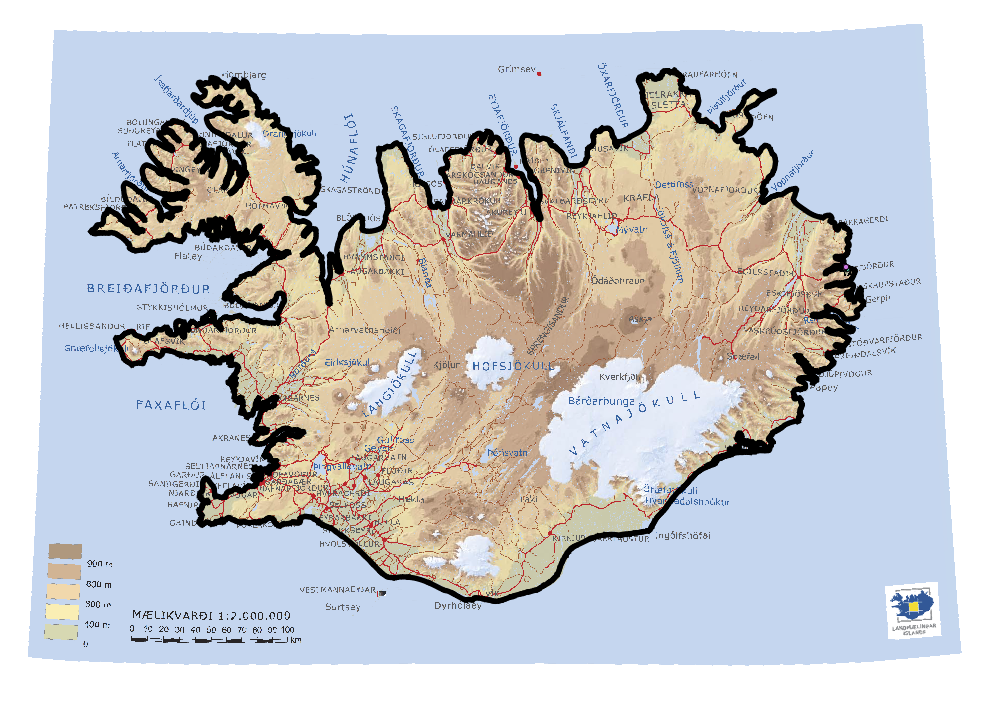
So for now, we are keeping all the Iceland 2014 and Nicaragua data in the old model on Postgres, and focusing on this years’ data, and getting that working in time.