Today marks the start of May Term, so we will all be working full time
The Beginning of May Term
on 2016-05-06
with
No Comments
Today marks the start of May Term, so we will all be working full time
This week, with help from Charlie, I got the TI Nano near-IR scanner working well on the bench. We can now scan the same samples we have been benchmarking with the FTIR so we will have good calibration curves to compare with our field samples.
I have also been working on the bench plan in general. The workflow I have come up with is below:
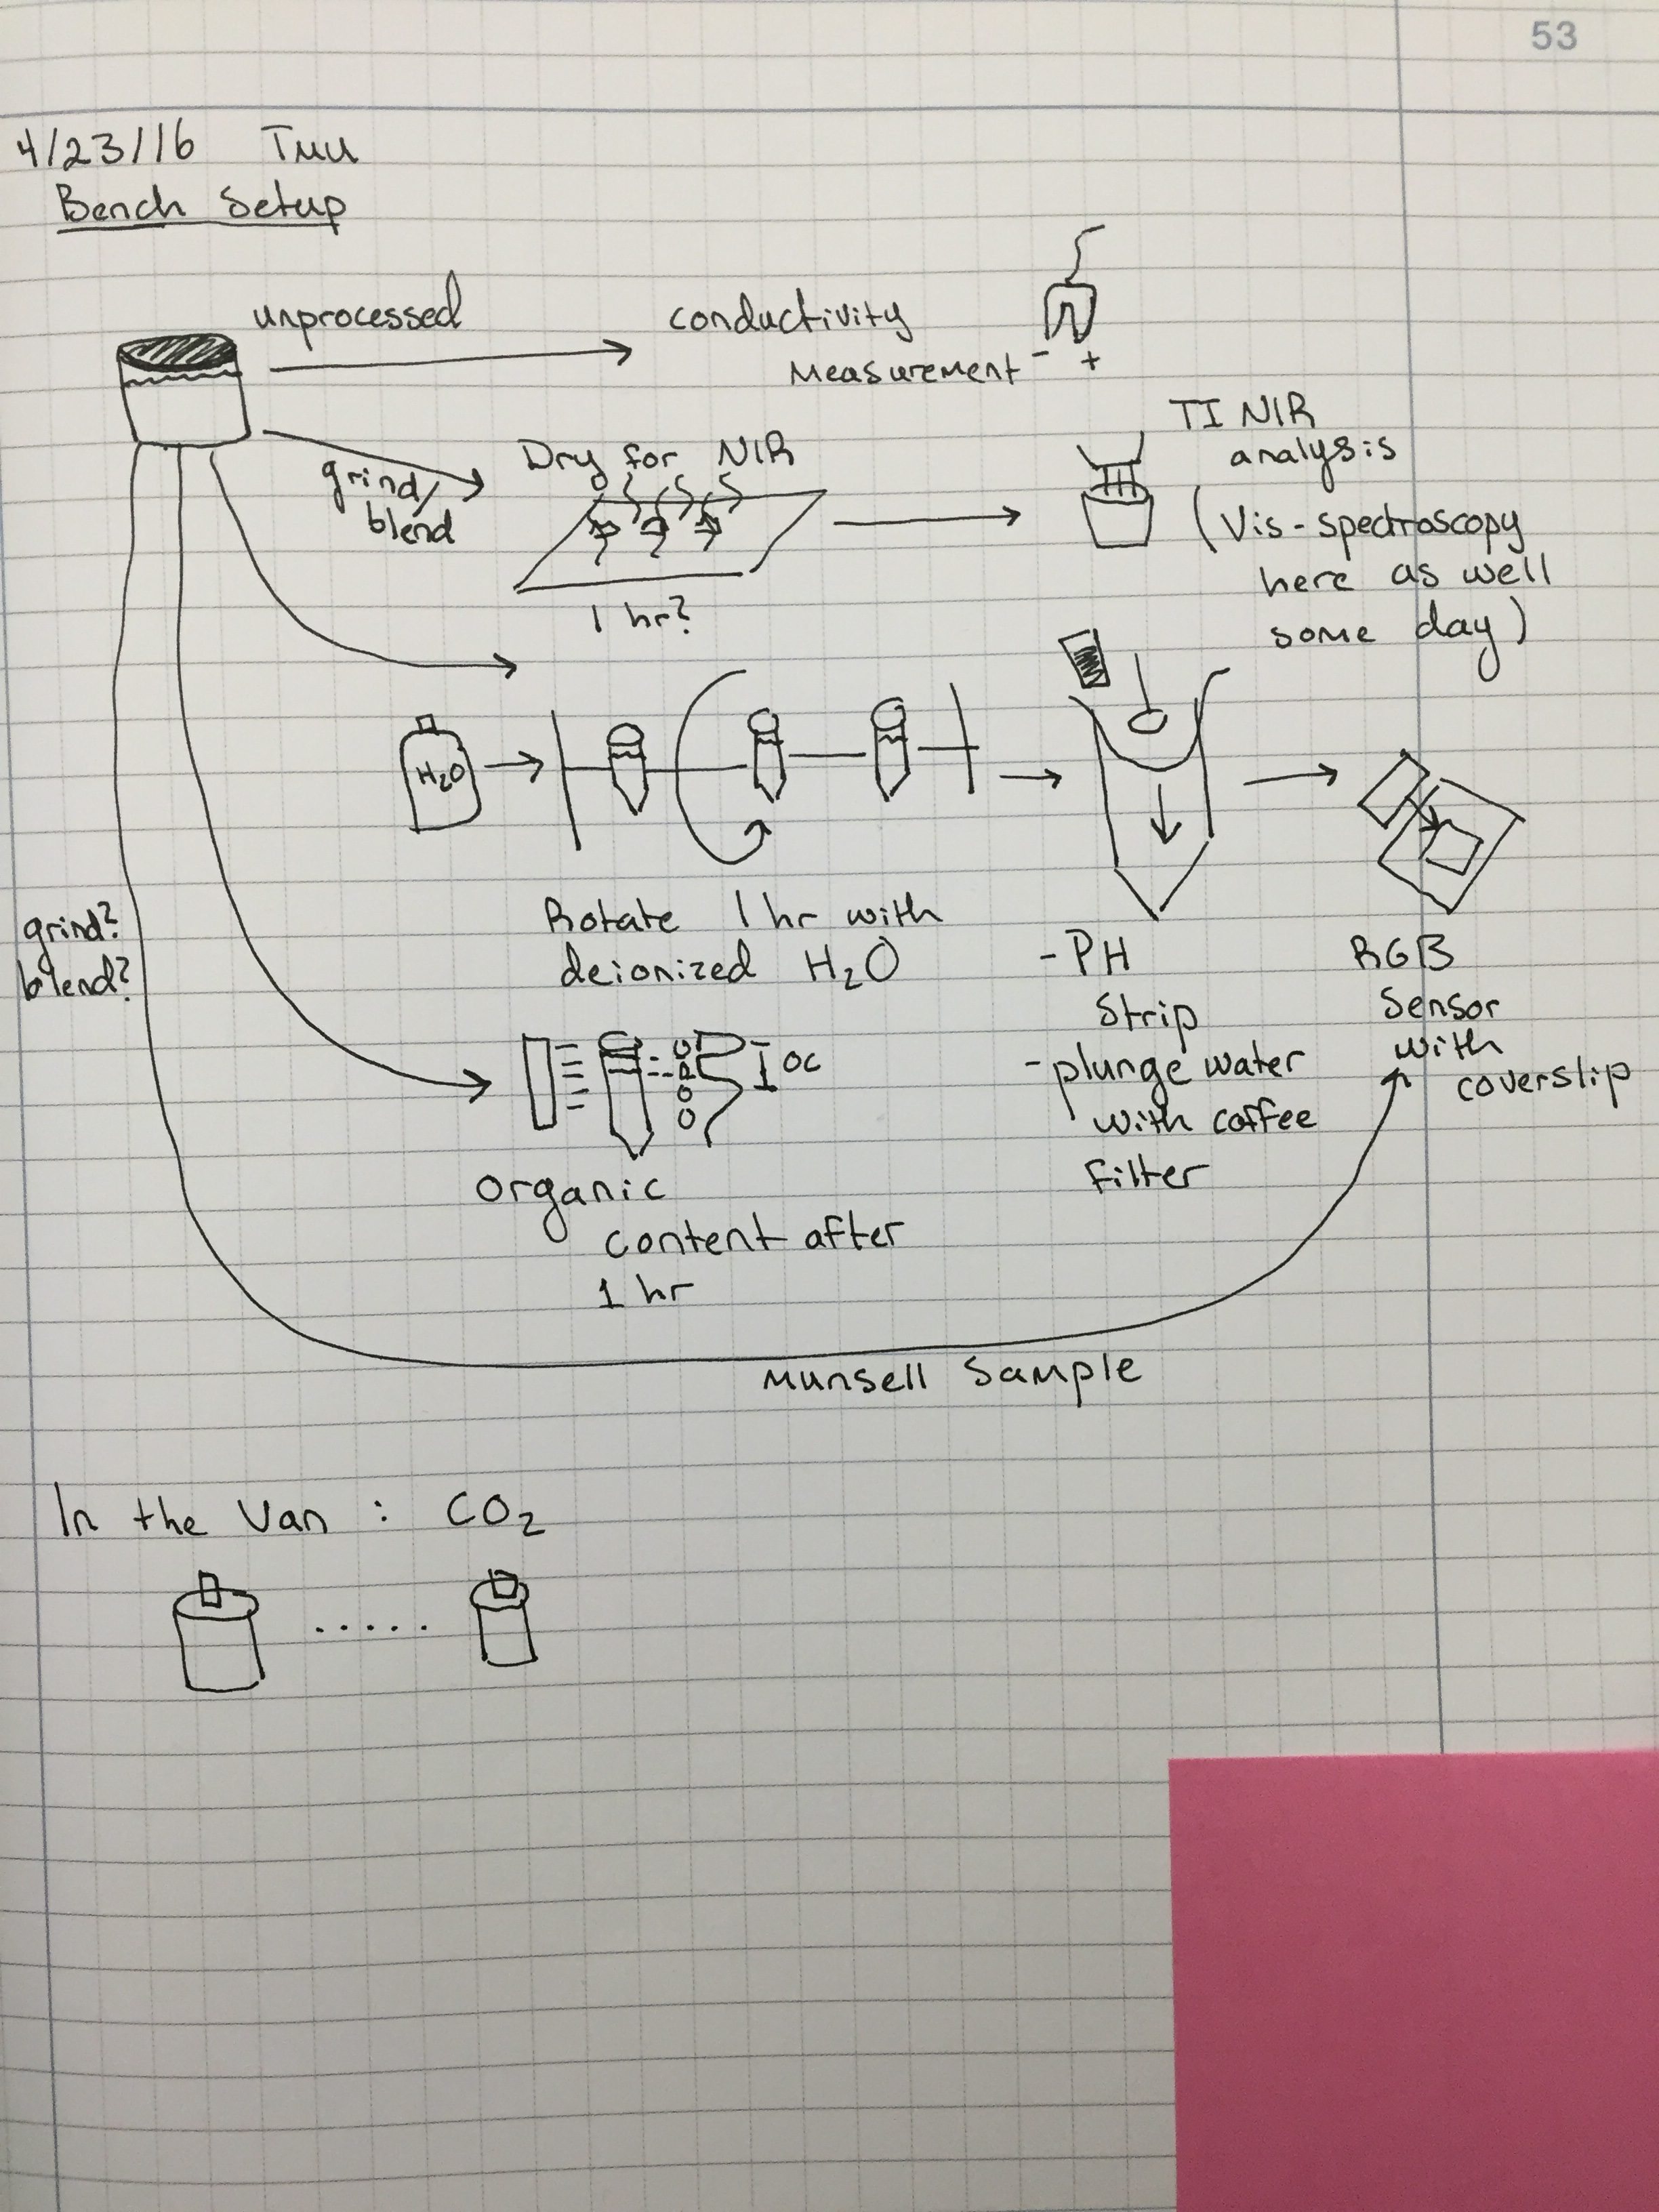
Kristin booked our tickets (yes!), and I ordered high precision barometric pressure sensors (to be used for altimeters), Adafruit Feathers to use as the micro-controllers for the ambiance/orienteering and soil (field and bench) platforms. This model has BLE and a battery charging circuit. I built a simple rig for the NIR sensor and scissor table, this is one of the bench soil platforms.
The next thing I would like to wrestle is reconciling the data stream that comes through the sensors into the database. Given that we’ll be collecting readings from multiple sensor platforms at each spot we need a way to aggregate those. This mirrors what happens with 911 incident data, in that case it’s the call number that binds all the different responses (fire, EMS, etc.) to an incident together.
Lots to do, 58 days to do it in…
This is going to be a pretty short post. Our flights are booked! It’s a good thing we booked them now, there we almost no flights to Reykjavik on the day we wanted to leave. We’re going to have to be really nice to people to convince them to let us sit together. Only 60 days!
As I mentioned in an earlier post, I had only managed to get a working ros lidar work station (environment) working on an ubuntu virtual machine. There are several issues with this though; all of our other developing environments are already in OSX, getting the /dev/ ports configured correctly to ubuntu through OSX is brittle at best and if something goes wrong it borks the entire virtual machine (its just faster to re-install than to actually fix the problem manually), and running the ubuntu vm cuts down on the battery life/processor/ram of the hardware. So with this in mine getting the environment up and running on mac has been a priority.
I was successful in being able to build a working “basic” work station on mac running OS X El Capitan (I’ll put instructions in the gitlab). The basic work station can’t do much except actually launch the visualisation app rviz or any of the other tutorial apps. The next step is to dive into the lidars available SDK for the mac architecture and build a node from that capable of pushing information to the sensor into the visualisation (and other nodes). Luckily the SDK is available in python and C flavours so hopefully it won’t be too complex.
Okay, so success has smiled upon me (for once)! After many, many, many, many, trials I finally got the LIDAR to map in a real time slam visualisation (I will upload a video example asap). ROS works using a subset of “nodes” for each application, sensor input, etc. So in order to get the slam vis running you have to have the main the LIDAR input stream node running, the slam node running, and then tell them all where to dump their data before finally launching the ros visualisation and hoping that it all works together. Rather than starting them all one by one manually I made a launch file (variation of a bash script) that does everything in the background. I’ve also created a git on the gitlab with some simple instructions, work space and launch files that I’ll update and add more to as time goes on.
Now that the mapping is up I can work on getting things calibrated. The LIDARneeds to be able to map when held sideways and scanning the ground rather than in a single 360º plane. The plan is to take advantage of its positioning. When the LIDAR is not perpendicular to the ground it will simply shut off the laser and not record data points, this way our final “scan” will only be those taken within a tighter angle boundary. Once this is working Ill be trying the LIDAR scanning at 3m (10ft) and see how accurately it picks small objects up. This will translate into how slow the drone has to fly to achieve maximum map resolution.
The other week when I was forced to take the LIDAR unit apart I was able to examine the internal design. The end goal with the LIDAR is to be able to sweep a flat ground surface, this means that we will have to limit the beam to ~30º beam angle. The simplest way to do this will by a custom top housing. The inside part of the top housing will spin freely on its own while the outer part of the top housing will be fixed with a limited view “window.” It will have to be from a material that won’t reflect the laser as to not gather bad data points while its spinning inside the device (though, it would be fairly simple to find these data points and ignore them in the code). Charlie also made the suggestion that the viewing window of the outer housing have shutters of a sort that allow for a change in view angle.
After consultation with professors Jose and Wendy who are teacher the GIS class, I have figured out generally what I need to do to really create a base layer. What I need to do is fix the projects for all the layers so that they are all on the same coordinate system (probably GCS World 1984). This should not be too hard, it is just taking more time since QGIS is a different platform from ArcGIS. I am also looking into the images that we have and using them as the basemap.
On another note, omni maps has still not called me back. So, we are unsure of the status of the maps we ordered several months ago!
In my last post, I said that I was going to switch all of our individual fragments of sensors to one that is ‘Bluetooth Sensors.’ Since then, I have finished that and redesigned even more of Field Day.
After I finished switching all the fragments to one, I dove into working on BLE connection with the Light Blue Bean (LBB). Unfortunately, the LBB does not do Bluetooth the same way the Red Bear Labs shield does. The LBB uses something called ‘Scratch Characteristics.’ These are built-in 5 characteristics that can be written and read from the client (in this case, Field Day) and the server (the LBB). These characteristics have set UUIDs, so that means I can’t use the custom UUIDs I set for the RBL’s sensor. After browsing some of the android SDK code from Punchthrough (the people that made the LBB), I was able to determine the UUIDs that are used for the characteristics. Since Field Day is going to have to determine what kind of device it is connected to, I redesigned it so that the fragment is cleaner and doesn’t do any of that work. There are separate classes for a Bluetooth Sensor, GATT Client, and Bluetooth Service. The Service talks to the Sensor and the Sensor talks to the GATT client and determines what type of device it is connected to by checking the UUIDs. All the Fragment does now is say when it wants to write a message or read a message.
Punchthrough has sample code available for arduino and reading and writing the scratch characteristics. The examples along with the SDK has proven helpful when rewriting the android code to accommodate for the Bean. Unfortunately, not many people have used the Bean with Android. All of the examples are with iOS. Field Day is able to read scratch characteristics just fine from the Bean, but is currently unable to write to any characteristics. One huge problem with the bean is that everything is Bluetooth. It’s not like arduino where you plug in the device to your computer to upload code and power it on. This means that the Bean can only be connected to one thing at a time and thus, is really hard to debug. Typically when debugging arduino devices, I’m able to plug the device into my computer and watch the Serial monitor for debugging code I’ve added in. With the Bean, I cannot. It’s blind debugging and it sucks. I’m still working on figuring out how to write a characteristic and have the bean read that characteristic, but I think I’m getting closer. I hope to finish that this week.
This week I worked on getting the coordinate function working in the field science database. It’s now up and running, which means we have a quick and easy way of finding the distance between two points in our table. This is help a lot with remaining cleanup, since we’re now able to get a distance value between two points to help us understand if the data we’re looking at is where we think it is.
I will work with Charlie this week to start populating the readings tables with all the missing sectors in the Iceland 2014 data, which is now easier now that this function allows us to contextualize the difference between two consecutive points in the table. This also gives us the ability to see how many of the points in the table are within a given mile radius, which is also going to be really useful with clean-up.