visualisation and flight

with 1 Comment

This past week has been a busy week. I spent a great deal of time working with Erin on the UAV Lundi where we were able to do test flights in fairly heavy wind, get used to the camera system, learn how to stitch images together. I got a chance to look into some of the customisable flight controls such as “point of interest”, “follow me”, and “waypoints.” The waypoints is particular interesting as It should allow us to define flight plans, save them, and then have Lundi fly them in the same way on its own. Most of the custom commands are going to come from a “ground control station” which is just an input form a laptop. I spent time looking into open source ground stations that have already been created but didn’t find anything exactly like I wanted. In order to remedy this Ive started coding up a few things using the DJI api to either create our own standalone ground station or add it into an open system. The goal is to have the ability to click waypoints on a map and have the drone fly the path with user defined specifications.

I’ll update shortly about LiDAR visualisation and information. Im working on creating a nice image and detailed instructions on whats going on!
 

Field soil platform

with No Comments

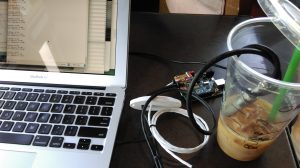
I spent some time yesterday resurrecting the soil humidity & temperature and high temperature water platform that Ivan, Kristin, and I originally made (and re-made) in 2013 and 2014. I was able to find all the parts, re-assembled it, found an Arduino sketch in the Sparkle Share folder, and viola it worked. The wiring and sketch are documented here.

IMAG0446

Back to list management…

Data update

with No Comments

This past week, I worked on getting some database views ready that would show us the results for the sampling day. This is so each evening in Iceland, we’re able to effectively and quickly QA the data we have and check to make sure what we have matches with what we should have. This is now set up so that we have views of data from the last 24 hours for both streaming and readings tables in the database. The views are currently set up so we can see the recordtime, latitude, longitude, elevation, sensortype and sensor value for the streaming table. The readings table view displays the time, site, sector, spot, sensortype and value for the last 24 hours.

I also finished up the ER diagram for the data model as it now stands in our database with a couple of changes from the last iteration.

I began working on learning enough about flask this week to start adapting the viz tool to work with the current data model, and expect to make more headway on that this week. I also started writing up and documenting all our tables and why we chose to structure them the way we did, along with explanations for the relationships between the tables and how we chose those.

‘Stitching’ Photos and Other Adventures

with No Comments

Charlie and Kristin gave me data from the last trip to Iceland on soil samples and the archaeology site. The data had XY coordinates in it so I was able to bring it into QGIS as a csv and visualize them on the map of skalanes. I did the same with the coordinates for the fox dens that Oli gave us. I was able to check with Oli, fix what needed to be fixed and confirm their locations.

I had a lot of communication with Anna from TREK Iceland this week. I confirmed with her what our needs and we finally have everything straitened out. I just need to hear back from her on prices and on a guide confirmation (I asked for Gummi however said that we are flexible if need be it would just be easier with him).

Next was a lot of work this week on stitching together photos taken by the drone. Nic and I went out quite a few times this week to both practice flying and getting pictures of the area at different heights. We took series of photographs from 10, 30 and 50 meters and I tried to stitch them together. Stitching them together is not very difficult when in reference to just each other because I just georeference points relative to points on other photos. The difficulty is placing them in relation to the world. I tried using google earth images to reference them but I am beginning to thing that taking a GPS point of known features in the area and using those as reference points may be more successful. I want to try this out this week.

This weekend I worked on installing QGIS onto the macbook going to Iceland and I brought over the map I have made so far. The only part we need to be careful about here is that any layer in a map you are using must be sourced to a place that that computer can access (eg. that computer). We can change the source but I had to individual make sure each layer was included separately when moving data over. Again pretty simple but it is good to be aware of and it takes a little bit more time.

Breaking news…

with No Comments

For two weeks I’ve been trying to figure-out how to add the Iceland playlist Kristin created to my Spotify profile. Yesterday, Kristin explicitly shared it with me and that worked, phew. I was afraid we were going to have to cancel the whole project.

On more mundane fronts I’ve been working with Erin on the GIS and maps, with Kristin on Field Day, with Deeksha on the data model/data, with Tara on the NIR and tube turning rigs and Mothur, and with Nic on LiDAR, the UAS, and imagery. All of these are coming along well, we have lots to do but we are steadily moving along together. Go Team.

For Field Day Friday we made a simple lunch of pasta with pesto and then took a short walk around campus collecting data with Field Day/ambiance platform and the Yoctos. The streaming and sample data has been uploaded from the Nexus to Postgres, next week Craig is going to visualize it and start doing verification and validation on it. This is the first time we have had the luxury of working with an “independent lab” on this aspect, in the past developers did this (about as well as you would expect them to).

I setup IceBook (13″ MacBook Air) for Erin to install QGIS on. Slowly we will be migrating all of our software stack (database, analysis tools, visualization, time synchronization, etc) from hopper and other machines to IceBook. Just before we leave on the 22nd we’ll move our Git repository over and viola, we’ll have everything with us. We’ve done this twice before in Iceland and once in Nicaragua and it works really well, being self-contained helps a lot when Internet access is spotty.

Next week will probably look a lot like this past one. On Tuesday morning NIc, Erin and I are going to talk to Patrick about GIS and archeological surveying at Skalanes.

Building Device Housing and Bench Tools

with No Comments

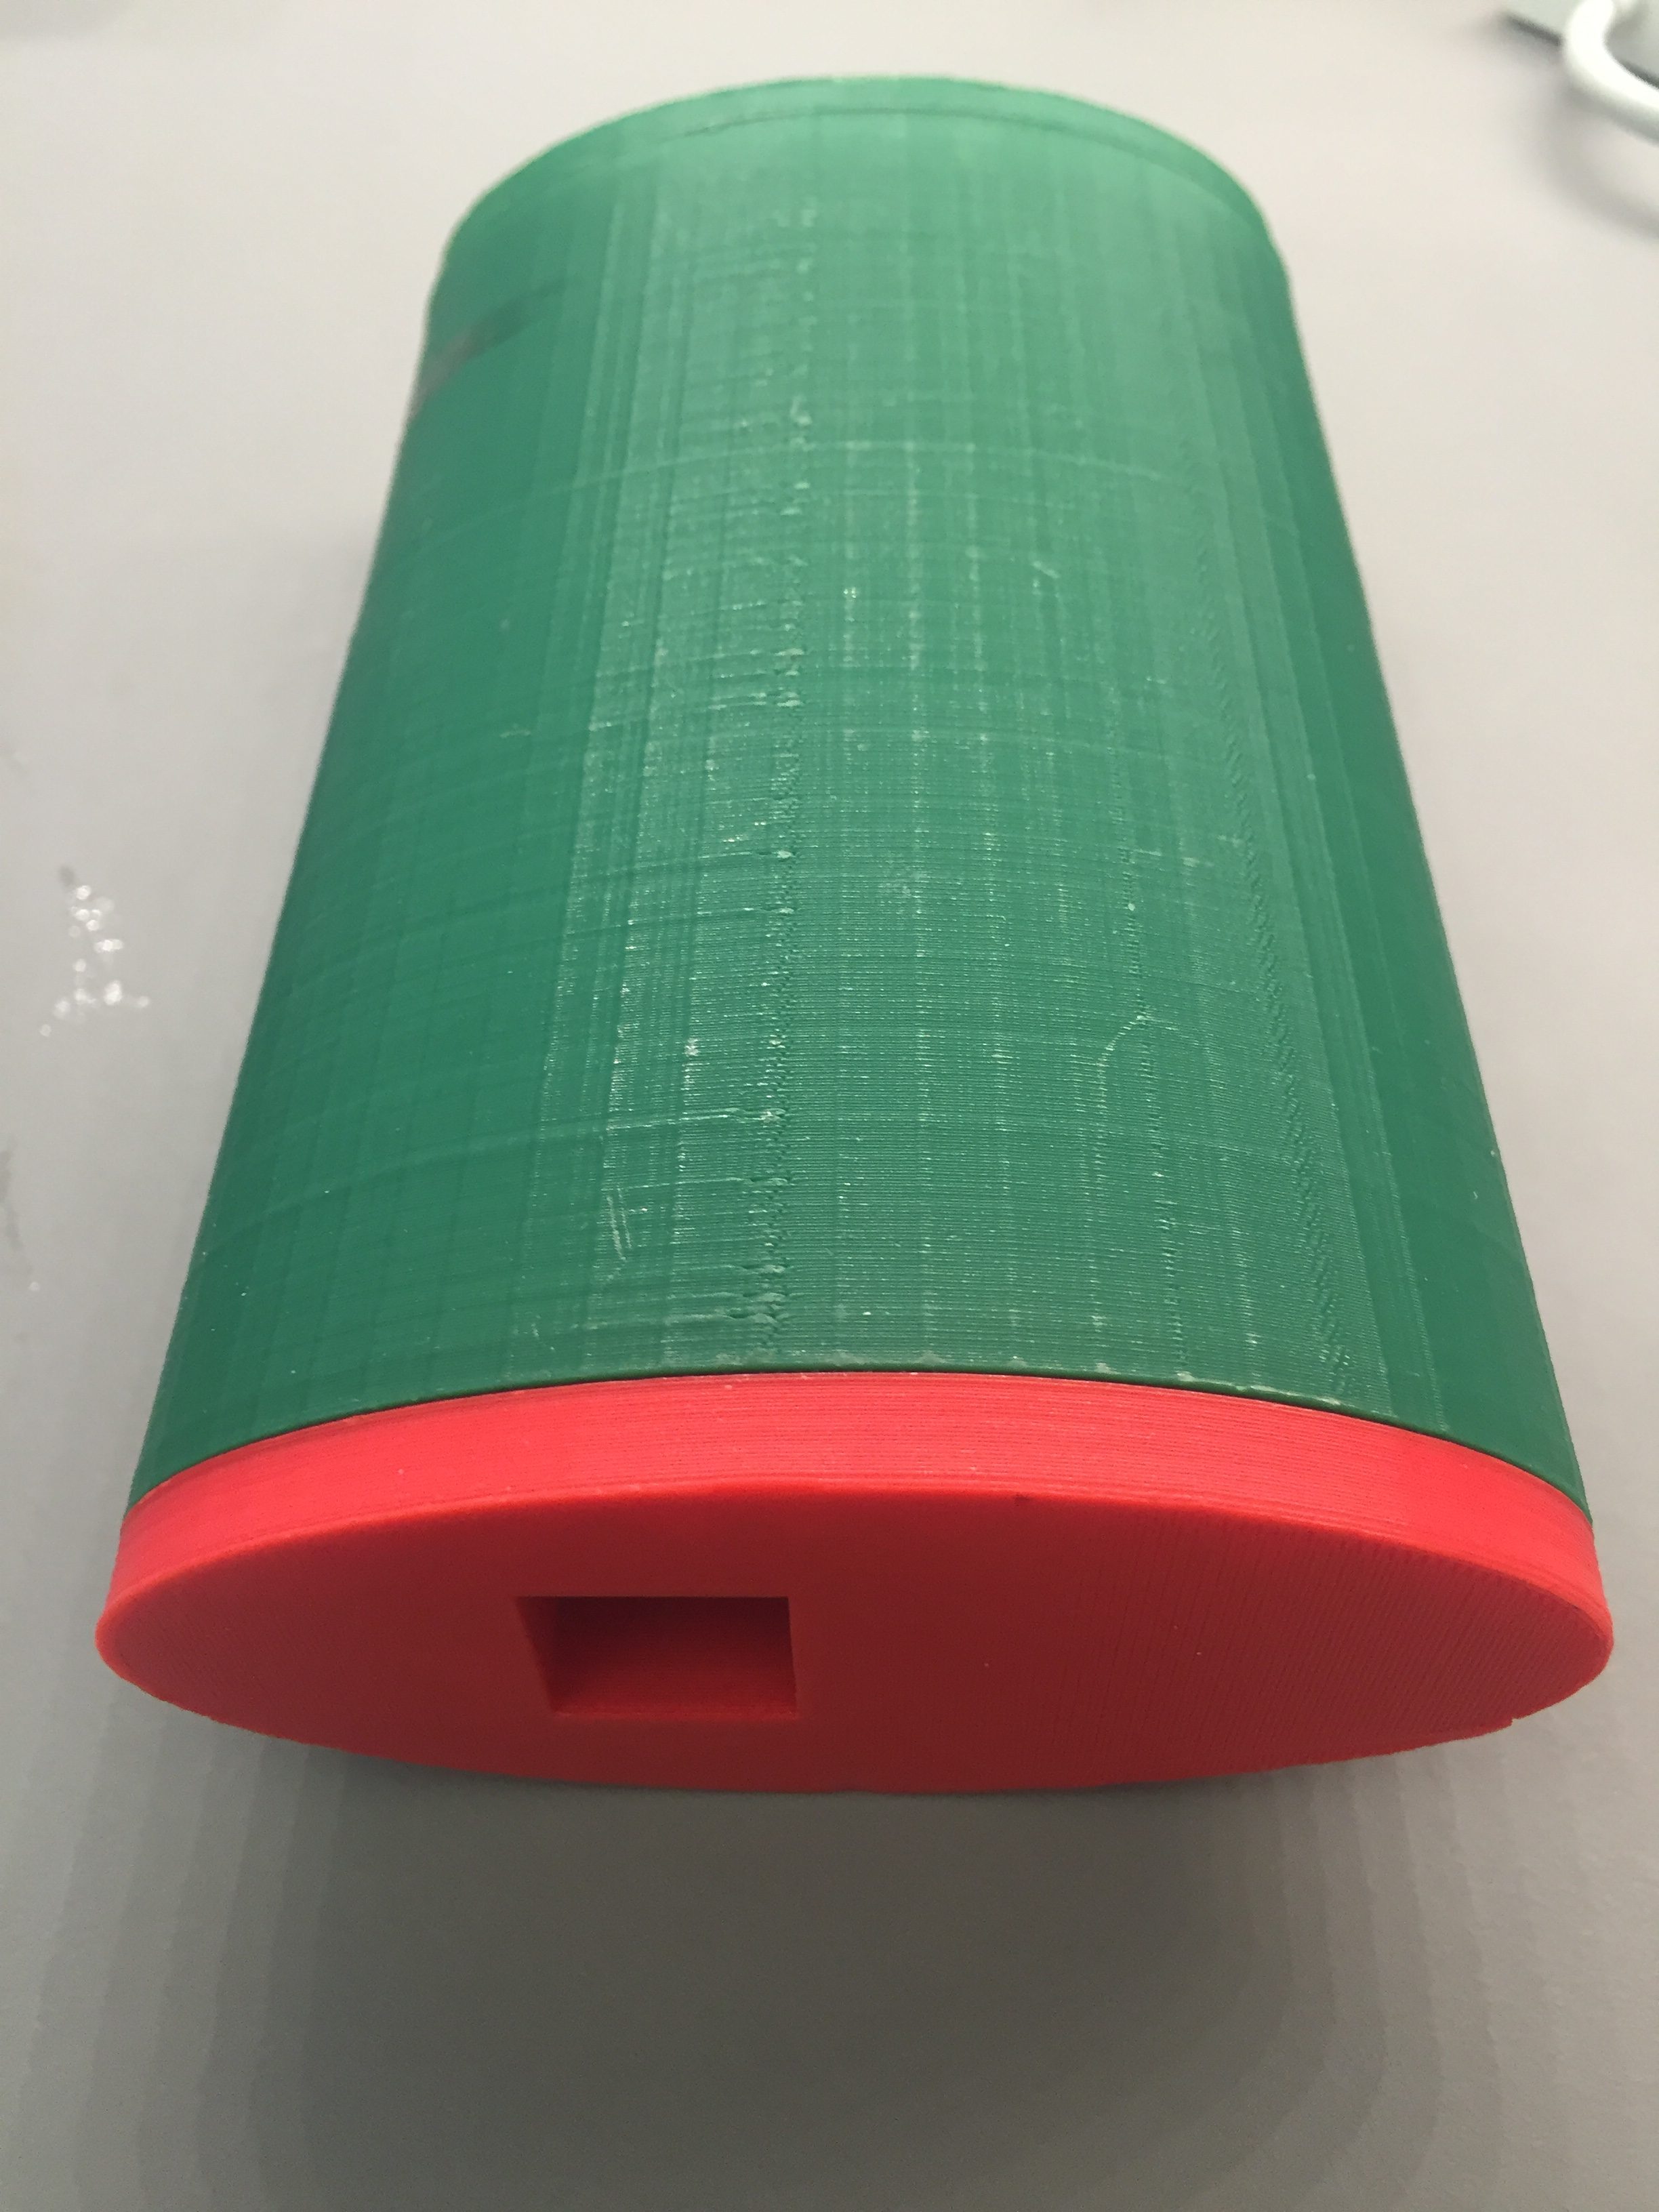
Each device I am prototyping for bench or field work needs some kind of housing so that it can serve its purpose and/or stay operational in wet or dirty situations. There are three  I am focusing on now:

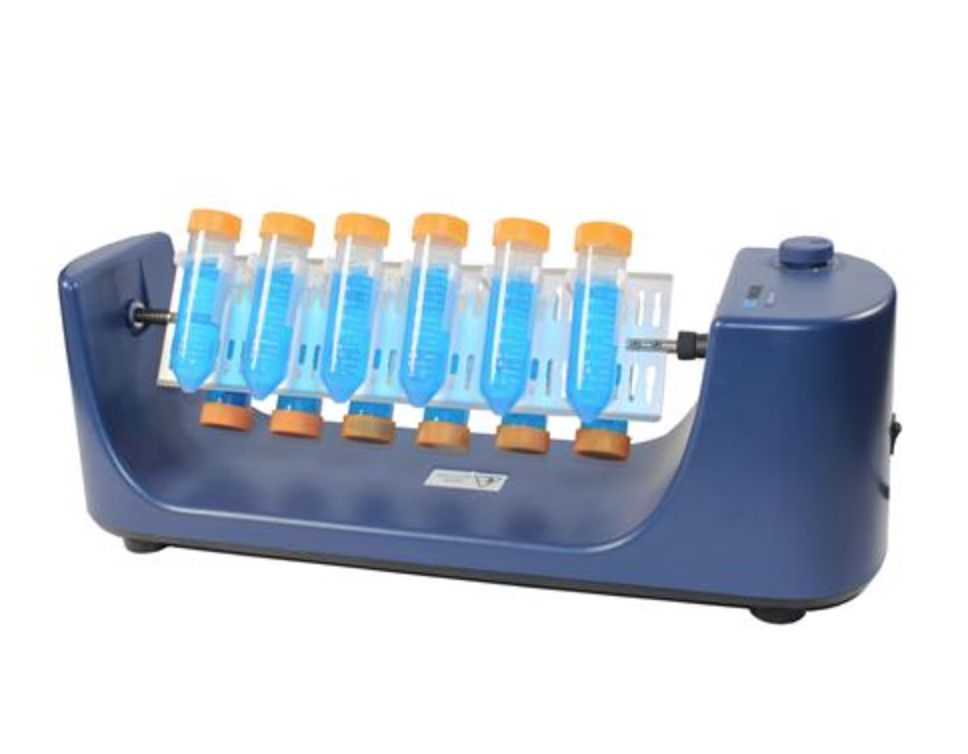
  1. Bench top flacon tube spinner. Originally inspired by this device that costs $100+, the bench spinner is necessary for measuring accurate pH of soil. Charlie and I have come up with a device that can spin up to 10 falcon tubes at a time and will be made from PVC pipe, epoxy, and potentially a lego  motor.
    Screen Shot 2016-03-23 at 10.49.19 AM
  2. Field sensor case. Modeled off of the 3D printed ‘flask’ design previously used in Iceland. The case will be larger to house a BLE shield and will have a hole with some kind of cover to protect the IR temp sensor (working with BLE). Right now I am trying to figure out if the soil moisture/temp probe (not working right now, may be toast) and the conductivity probe (working) really need to be out in the field or if the same data can be gathered on the bench. Once everything is working and in some kind of preliminary housing I can test that.IMG_1558
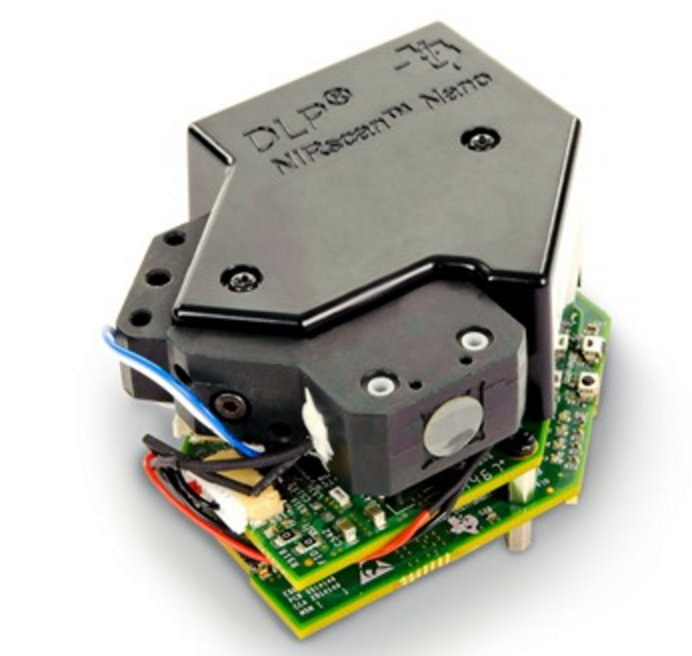
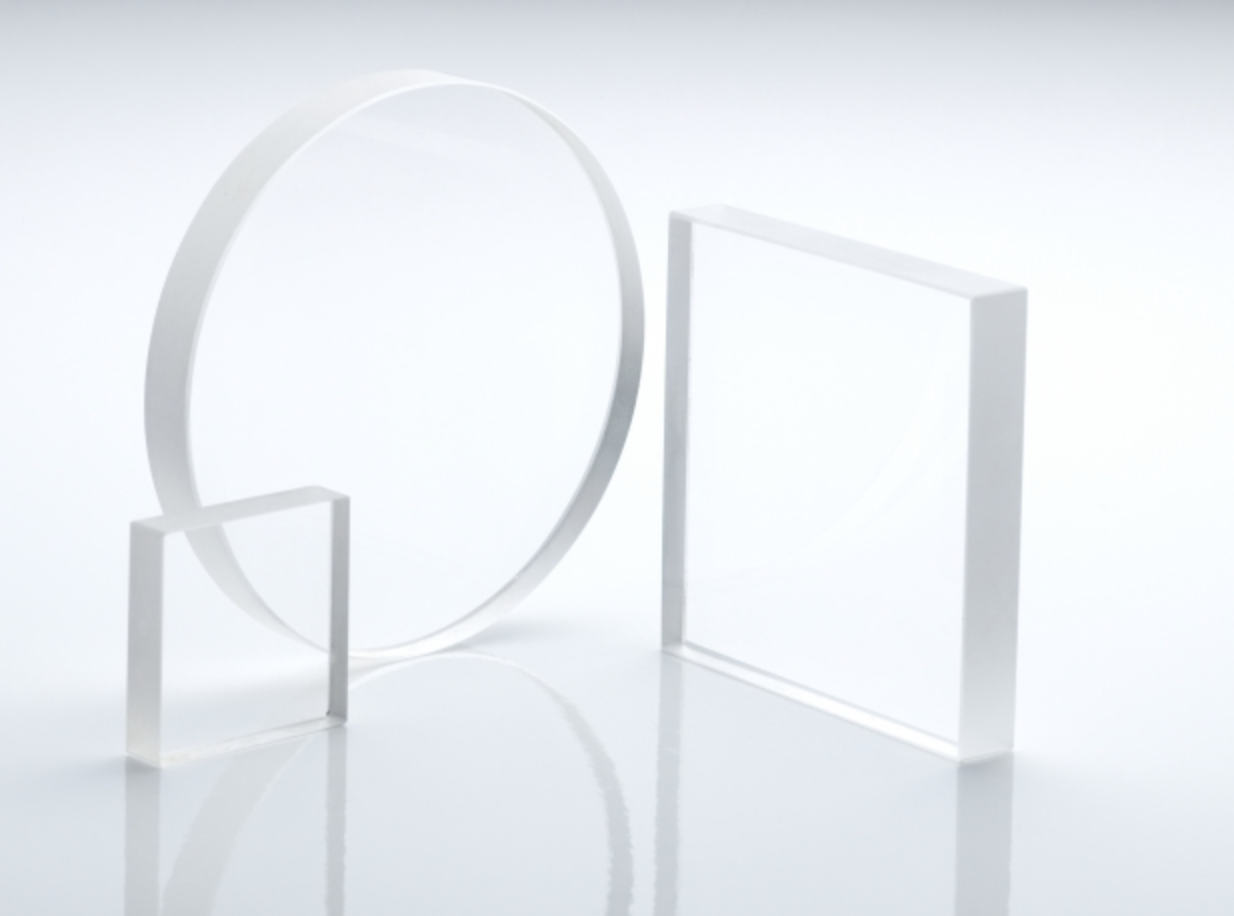
  3. NIR TI Nano housing. We have just purchased two quartz crystal coverslips that transmit NIR radiation. I want to build one of these into the housing for the nano so that the internal optics as well as the micro controller are protected. The coverslip is about the size and thickness of a quarter. It is important that it is completely flush with the Nano optics and that it can be lowered completely onto the sample so that the distance between the optics and the sample is not only minimized but uniform. Until the quartz slips arrive I have stalled testing and calibration of the nano to protect it.


Screen Shot 2016-03-28 at 10.12.43 AM

Screen Shot 2016-05-27 at 10.13.00 AM


Two other things that are temporarily on the back burner but are still important:

  1. The CO2 probe. If it works, this probe would allow us to measure CO2 respiration as a proxy for microbial biomass. Charlie had the excellent idea of attaching the probe to one end of a long PVC pipe full of soil, to increase our sample size and not disturb the microbes by digging up and mixing their soil habitat.
  2. The RGB Munsell color sensor. I have started experimenting with colors the RGB reads and have so far been a little disappointed by it’s accuracy. I will work on compensating for ambient light and optimizing the reading in one color space before using a linear transformation to convert those values to Munsell space.

Two final ideas are on the lowest priority in the ‘if I have time before we leave’ category. They are:

  1. Bench-top light-transmission organic content. A fancy name for shining light through a tube and measuring the thickness of an organic content band. This would be cool because it’s automated but it is easy to do visually and might even be more accurate, so it’s not a high priority.
  2. RGB pH strip measurements. This one is also easy to do by sight, it isn’t difficult to match the color of a pH strip to a key. However, once the Munsell color platform works, adding this functionality is simply a matter of writing the software, because the hardware setup is the same. For that reason it is more likely to be completed then the OC reader, which is somewhat design intensive.

Lab Notebook on Field Day

with No Comments

This week, I’ve done a lot of work on Field Day. It doesn’t seem like much but that’s because I kept getting caught up in tiny errors during coding. The biggest thing that I’ve added to Field Day is part of the Lab Notebook activity. We decided this week that integrating Google Drive is less important than being able to open local files. We decided this because we will not always have internet access in Iceland and that’s essential for Drive if we want to update our files. The Google Drive API for Android also has limited options. The Android API only allows the application to access files that were created by the application itself. Since most of our files are PDFs and the Android API doesn’t allow uploading, we decided to move away from that for now. There’s a Java Client Library for Google Drive which has many more capabilities that we will probably use when we go back to Google Drive.

I’ve begun working on the local documents viewer and have successfully downloading files and displayed the pdfs. There’s now an option to download files where the user provides the URL of the server where the files are and the path to the directory with all of the files in it. The code relies on the directory having indexing enabled. Field Day goes out and queries the directory and returns a list of files and folders. The user is asked to select which files to download. If a folder is selected Field Day goes out and queries that folder, etc. until the user hits ‘Download.’ The files are downloaded and stored on the external storage (the SD card) keeping the directory structure that Field Day saw in the remote directory. A list of files of is displayed on the screen to the user. Upon clicking a file, the file is displayed. Currently it works for only PDFs and JPEGs which are handled as Bitmaps. Text files are not. If a folder is clicked then the folder is opened and the files and/or folders in that folder are displayed.

Iceland Land Survey and the Glaciers

with No Comments

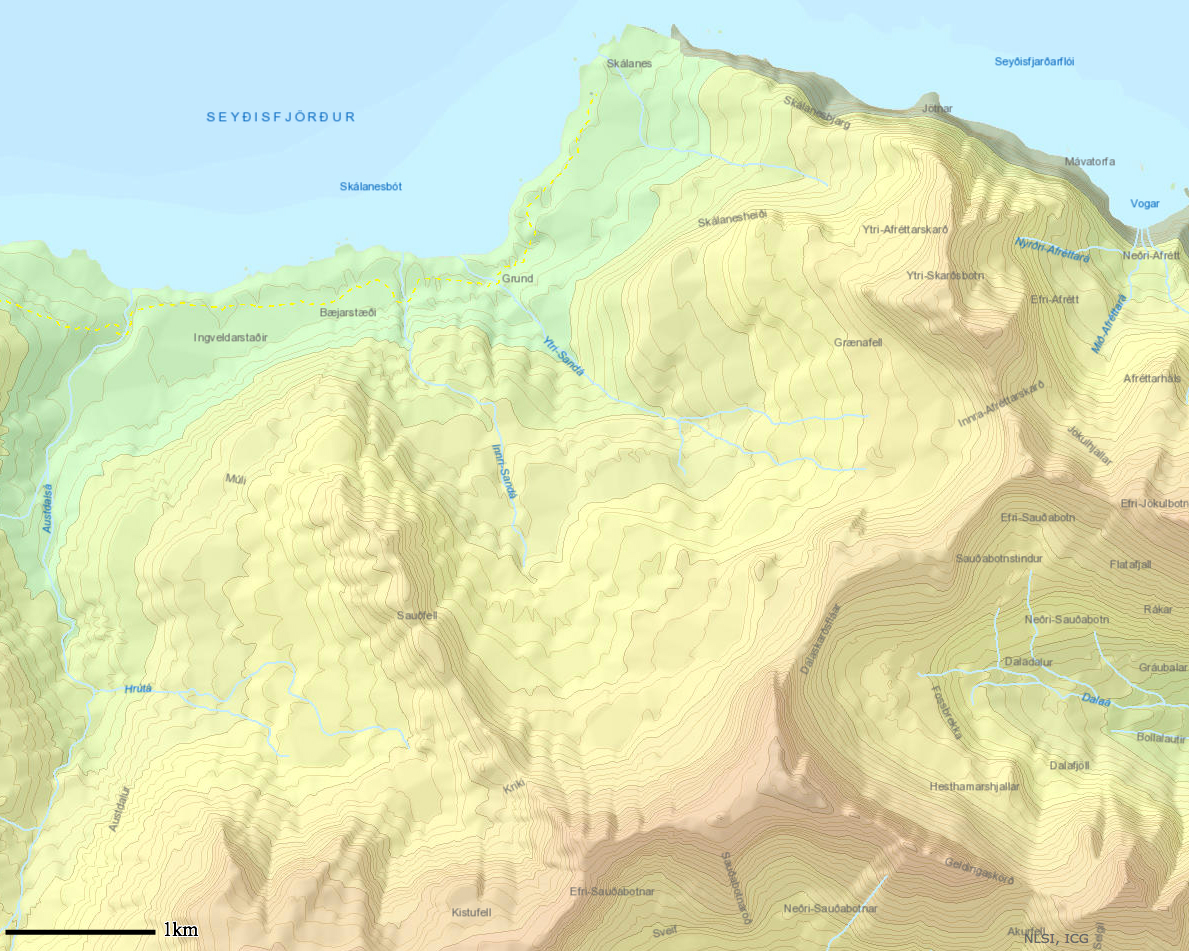
Early last week I found the National Land Survey of Iceland’s ArcGIS map viewer. This proved to be a very useful tool. This allowed me to make individual topographic maps of all of the places that we will be going. The tool allows the user to add there own lines which allowed me to create a scale. I highly recommend playing with the tool (link below)! I printed the maps in color on 8X11 paper and they are next to the computer in Hopper. The next step is just to laminate them and make sure we have all the places we need. The following is an example however I did this for the five different glaciers- Sólheimajökull (smaller glacier); Skaftafellsjökull, Kviárjökull, Svínafellsjökull and Fjallsjökull (big glacier). I also did this for Þingvellir, Heimay, Grímsey and Klauster, all of which are areas we will be visiting for either science or studies purposes. Klauster and Þingvellir have two maps of different scales in order to better capture the information we will need.

Land Survey of Iceland Arc Map in English

Land Survey of Iceland topo map of Skalanes with scale.
Land Survey of Iceland topographic map of Skálanes with scale.


I worked on many other small projects this week. One of these was getting in touch with TREK Iceland. This was a group who took the Iceland group on the glacier and to the river bank last time. I have been in tough with them over email and they will be taking us to the glaciers and to the river bank to get soil samples on June 28th and 29th. I have also been in contact with the map store in Iceland that I mentioned in my last post. Another small thing was researching glacier sampling a little more. I created a document in the glacier folder of links to informational papers and website to help us better understand the glaciers and how best to go about sampling them.

NIR Reflectance

with No Comments

This past week I mostly worked on NIR, the field platform, and a little on the CO2 sensor.

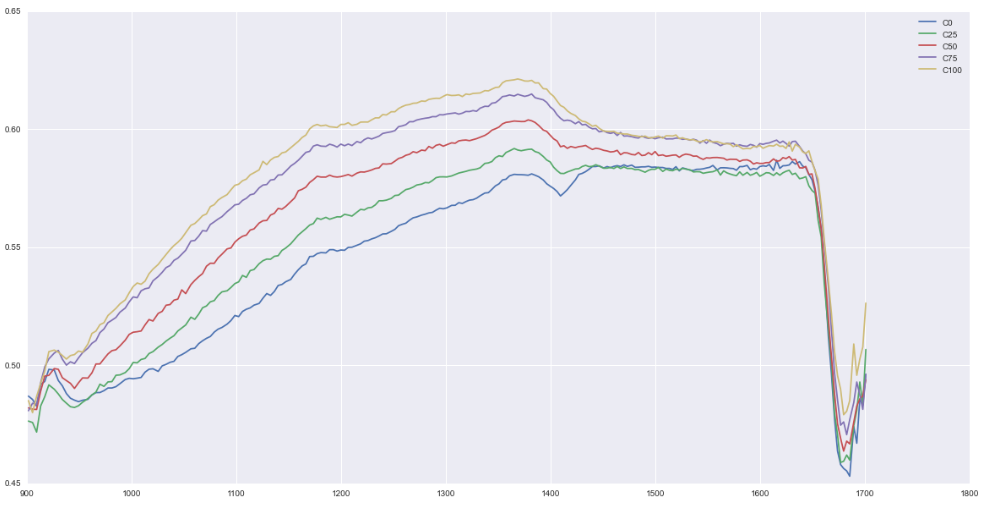
I converted the collected absorbance data from the TI Nano to reflectance, which is better documented for organic content. I reran standards that are a mix of sandy soil with very little organic carbon and compost, which is very high in organic carbon. These are the results:

Screen Shot 2016-05-23 at 10.53.41 AM

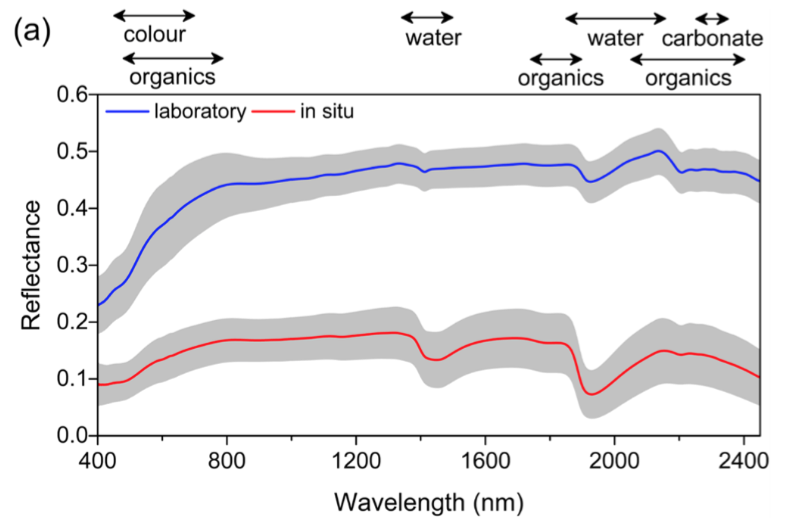
For reference, this is a figure from Shuo Li et al. [1]

Screen Shot 2016-05-17 at 3.57.26 PM


I would really like if the nice peak between 1300-1400 was our organics peak, but I suspect we actually want to focus on the scraggly region out by 1700. My plan is to focus in on this region and increase the sampling rate of the device. The trend here is very promising.

The field platform prototype is coming along. I have incorporated the BLE and Field Day-friendly formatting, but I am getting readings that don’t make sense. This week I will focus more on hardware debugging.

The RGB platform is my next order of business. I am going to start with Munsell color. That will give me a good jumping off point for less crucial things like pH and NPK strip analysis.

[1] OrganicCarbonTibet

The low point of my day…

with No Comments

As near as I can tell from a quick look at the data collected by Field Day and Grace (our prototype ambiance platform) and the Yocto altimeter (based on the same MPL3115A2 chip that we use) this was the low point of my day yesterday at about 201m:

IMAG0439

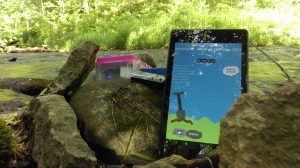
I started Field Day and the Yocto around Portland, Indiana and then drove home and walked down to the creek where this picture was taken. The highest point in Indiana is about half-way between Portland and where we live in Boston. The creek bed is the limestone floor of the ocean that covered this part of the US about 350mya. Neither device was calibrated, and we won’t know for sure how the track looks until Craig maps the data, but things are looking good.


In other news Nic has collected data from the LiDAR in the lab as it moved slowly over an object on the floor. We’re collecting theta, distance tuples at set intervals (1cm) along the track, I think we can visualize these as stacked wind roses as a first-order approach to “seeing” what it found. Matplotlib to the rescue!

1 2 3