The low point of my day…

with No Comments

As near as I can tell from a quick look at the data collected by Field Day and Grace (our prototype ambiance platform) and the Yocto altimeter (based on the same MPL3115A2 chip that we use) this was the low point of my day yesterday at about 201m:

IMAG0439

I started Field Day and the Yocto around Portland, Indiana and then drove home and walked down to the creek where this picture was taken. The highest point in Indiana is about half-way between Portland and where we live in Boston. The creek bed is the limestone floor of the ocean that covered this part of the US about 350mya. Neither device was calibrated, and we won’t know for sure how the track looks until Craig maps the data, but things are looking good.


In other news Nic has collected data from the LiDAR in the lab as it moved slowly over an object on the floor. We’re collecting theta, distance tuples at set intervals (1cm) along the track, I think we can visualize these as stacked wind roses as a first-order approach to “seeing” what it found. Matplotlib to the rescue!

Tests of light detection and ranging

with No Comments

Charlie and I had a conversation at the beginning of the week about if the LiDAR module we are using is the “right” one for our purposes. The bottom line is that we don’t exactly know and so I set out to answer that question.

IMG_4301-1IMG_4300

I built a controlled slider that gives us nearly 20cm of movement that we have control over when taking LiDAR measurements. My first test was to place a pencil on the ground and take 1minute of scans at each centimetre. The hope was to be able to pick out the pencil given “perfect” circumstances. After collecting the scan data, which consisted of only the distance in mm and the theta (degree angle at which the scan was take), I then artificially created a Y value corresponding to the 20cm of data taken.

After I got the data into a pleasing form I began to try and visualise it. This proved to be a tad bit difficult and I still don’t have it quite right yet but I was able to see something;

Screen Shot 2016-05-22 at 10.13.41 PM

I am fairly certain that the object towards the top of that screenshot is one of the legs on the tripod that the beam picked up. I am not entirely sure though and will continue to do tests until something is conclusive.

Sending data back and forth

with No Comments

As you remember, last week I finished the new data model implementation within Field Day and downloading remote database data. Field Day writes sensor database to the local database respecting the new model — populating fieldday_streaming, fieldday_reading, and fieldday_spot.

The big hurdle that still needed to be hopped over was sending those newly populated tables back to the remote database. This week I got over that big hurdle. The user can now upload the local tables to the remote tables. Field Day gets all of the rows in the tables I mentioned above, starting with fieldday_spot because the other two have foreign keys that reference the spot table. Moving the rows from the reading and streaming table is simple, but moving the spot table has different characteristics. If people are pushing to the database at the same time, we have to make sure that we are only inserting one of each ‘trip, site, sector, and spot’ which make up the primary key in the database. Field Day takes the ‘tripID, siteID, sectorID, and spotID’ of each row in the local database and queries the remote database asking for the count where a line has those four columns that equal the values in the local table. If the count comes back zero, then Field Day inserts the row. Each tables updating is wrapped up in a transaction, so if something goes wrong Field Day rolls back the transaction and sets the database to it’s previous state. Once the inserting has successfully finished, the database in the local table is copied to external storage in an /archive directory and the tables are dropped and created again so they are empty.

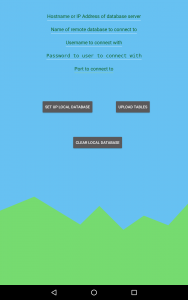
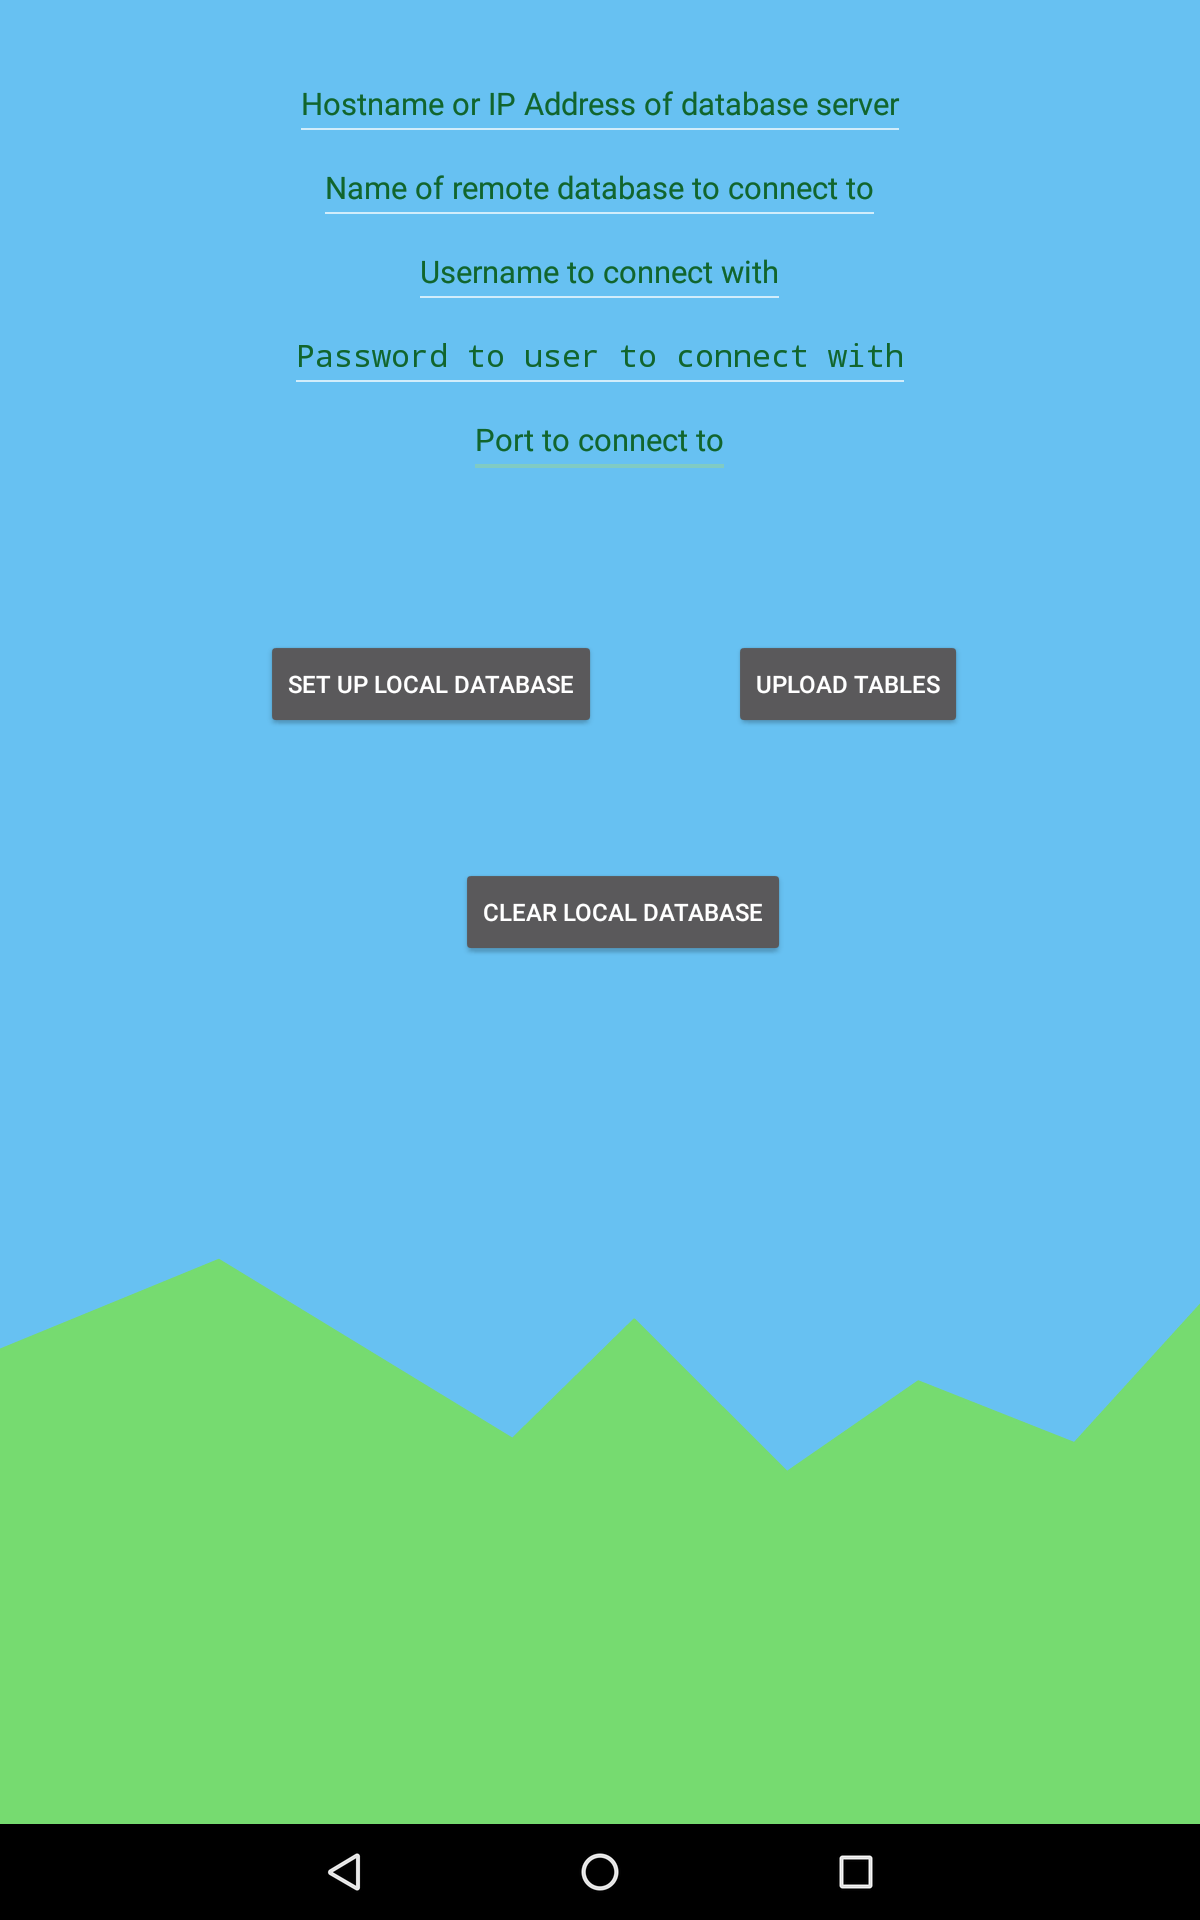
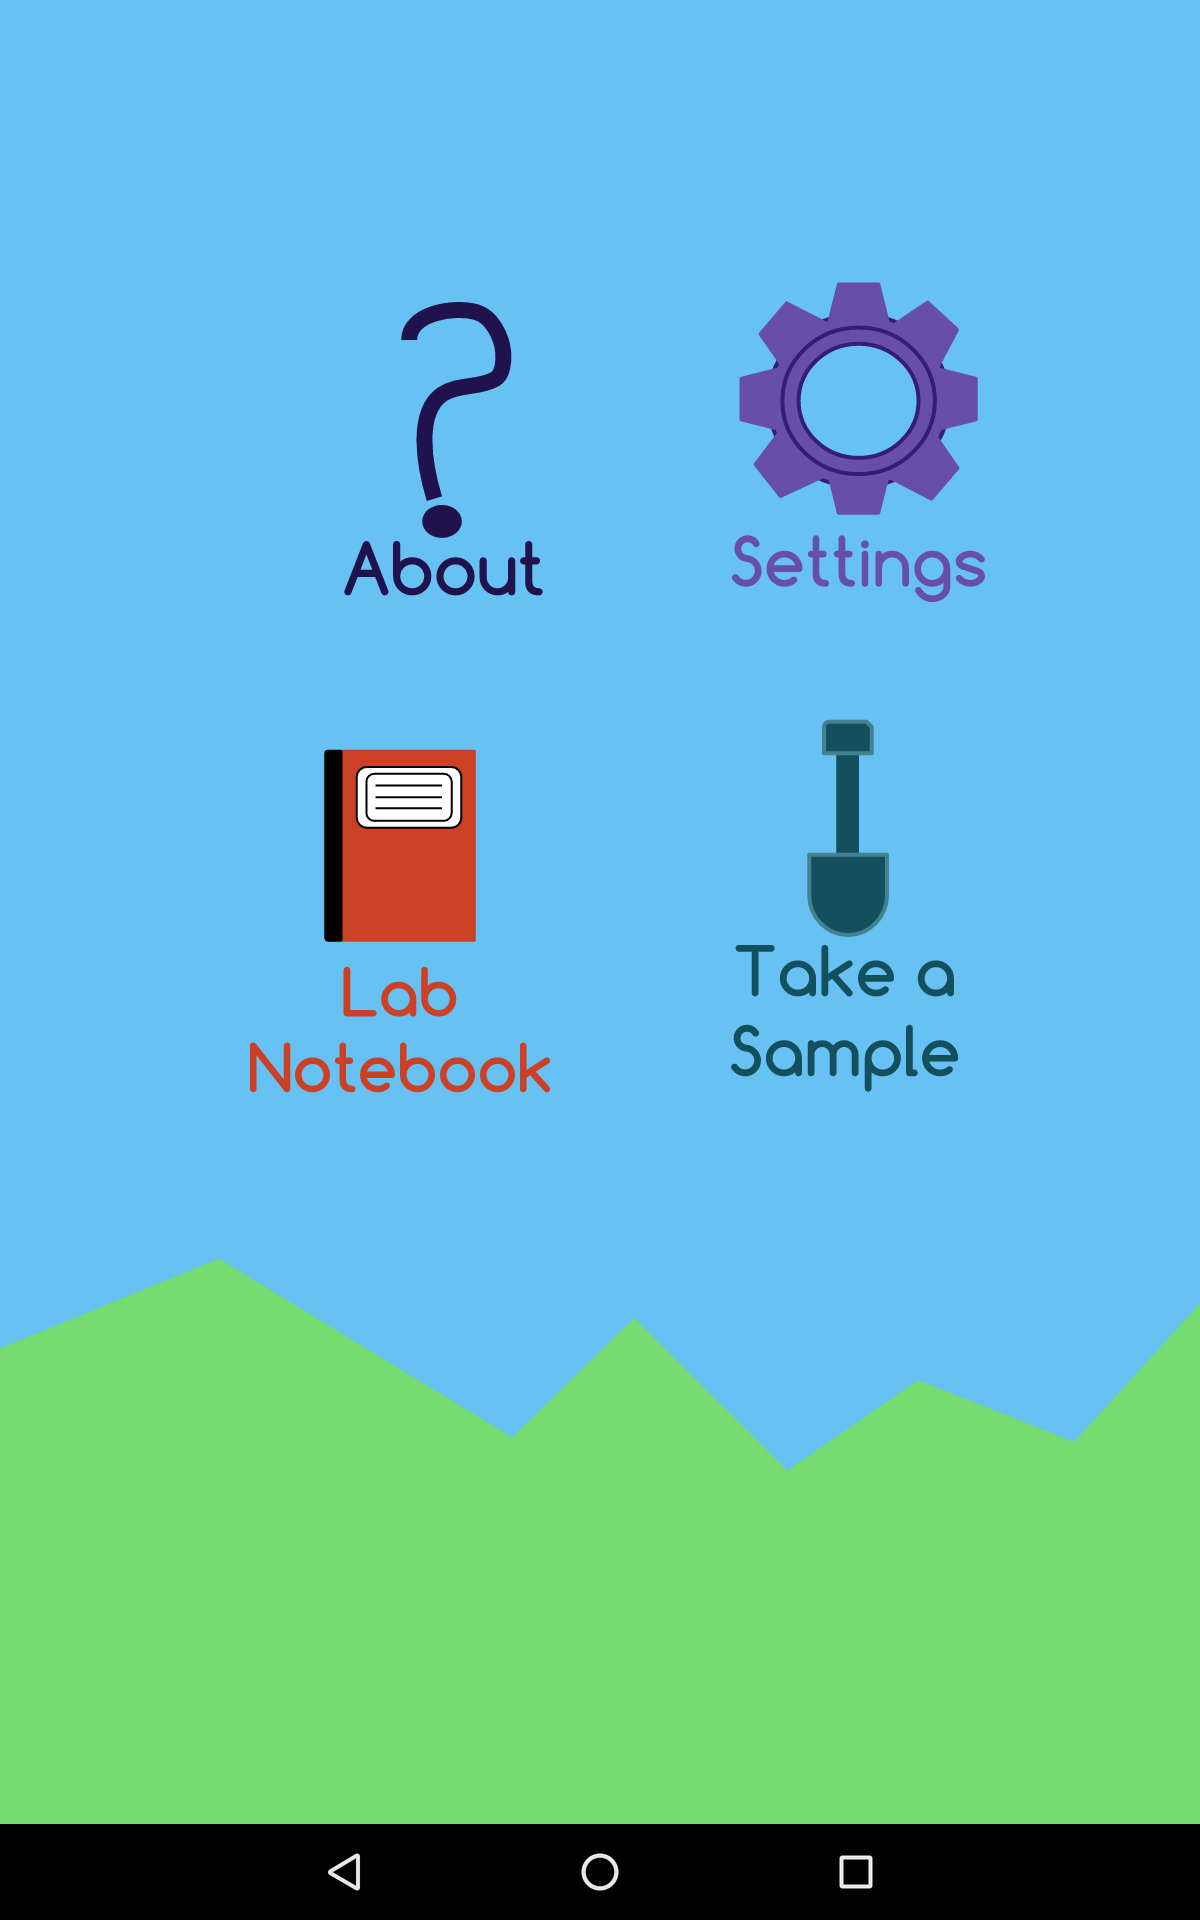
I moved ‘Take a Sample’ on the main screen to ‘Sampling’ and created a new option under that menu for ‘Database Actions.’ The downloading from remote database activity was previously under the Settings option, but since the application is basically doing the same thing in each, I merged them in to one activity. There are three buttons for the user to choose from (which you can see in the picture below) — setup local database, upload tables, clear local database. Upon the press of any of the buttons, the user is asked to confirm.  When the user selects clear local database, just like after the user upload the tables, the local database is copies and wiped.

A couple other small things that I’ve worked on this week are integrating the Google Drive Android API and fixing small things with the sensor sampling activity. As for the Google Drive API, I’ve gotten Field Day to the point where it asks for permission to access Google Drive, but doesn’t do anything after that. To my knowledge, this API only allows the app to interact with files that were created by the application itself. I’m not 100% sure of that so I’m still working on it. Small things that are fixed are the user is notified if they haven’t set up their local database with a remote database, which means they can’t write anything to the local database. When a Spot number is put in the spot edit text on the sampling activity, Field Day checks to make sure that spotID doesn’t already exist in the local database if it does, then it doesn’t write to the database.


device-2016-05-19-094627

Data Progress

with No Comments

This past week, the new data model was implemented after some K,C and I talked about it for the past few weeks. We now have multiple tables in the model, with a table for basically every data point. I have been looking at Iceland 2014 data to figure out what data we can move over into this new model. I’ve learned that there isn’t very much data we’d like to move over from Iceland 2014, although almost all the Nicaragua data is good to move over (in the fall, once we’re back from the Iceland scrum.) The distance function came in really handy here, and made me really glad that we finally all have the old data in a single, easily searchable place. We’re not moving the data over into the new model, but it’s easy to query it where it is now (something that hasn’t been possible for a while)


So for now, we are keeping all the Iceland 2014 and Nicaragua data in the old model on Postgres, and focusing on this years’ data, and getting that working in time.

Lundi and LiDAR!

with 1 Comment

I’ll start with the UAV. Now known as Lundi* we have finally started flying. Our initial idea was to fly indoors however our Science Centre has some intense electromagnetic fields (who knew a mostly metal high tech structure would be filled with metal and electric??) so we ended up flying outside after a few initial tests indoors. The tests flights have been in areas we deemed low wind (plenty of building to fly into though) and minimal spectators as to not distract our pilots. Speaking of pilots, Erin and I will be the main controllers of Lundi (and possibly a sister UAV soon) and will begin practicing more and more. The rest of the team will also learn to fly them but only as time permits. The RAW digital negative images .DNG are around the size of 25MB and we can take 3 photos per second. Our next step is to explore the autopilot features of the UAV that will allow us to plot flight patterns.

Now onto LiDAR (we are now styling it as LiDAR). I built a prototype housing for the sensor that allows us to get roughly a 30º angle output. After many frustrating hours with ROS I decided to put it on the shelf for a bit and write my own code. I currently just take sample readings in an .xyz format but the ultimate goal is to pull information from Lundi to give us a full .las file which includes all sorts of useful meta data. Currently the sensor only knows how to take “slides” that are the size of the laser itself but I’m working on getting it to realise its scanning from the top down (part of what the x and y values do) and I can then import it into a point cloud viewer and we should be good to go! Currently in the .xyz format we are getting 600KB/s  which translated into 4.5MB/m. Ive also started to prototype a sort of “slider” for the LiDAR that would allow us to move smoothly across a set distance. This will then be mounted up at our 3m height and scan a patch of grass with a pencil hidden inside, the ultimate goal will be able to pick out the pencil from amongst the blades of grass.

Ill be looking into photogrammetry a bit more asap as well, its proving to be a VERY useful tool.


*we are under the impression that Lundi means puffin in Icelandic, if any of our Icelandic friends know differently please let us know… Id hate to be flying something called “your mothers pants”

NIR Progress

with No Comments

Stephanie and I have concluded our work making calibration standards with the FTIR. You can read about the work here: Soil_Paper.

The soil NIR platform is coming along very well. I have been taking spectra in the 900-1700nm region on the same samples we used to make FTIR standards. So far I am getting promising results.Screen Shot 2016-05-16 at 9.03.47 AM

The x-axis here is wavelength and the y-axis is absorbance. These results are exciting to me because I see a clear gradient in absorbance between samples with different percentages of organic carbon. They are puzzling because I would expect to see the trend reversed, with 0% carbon absorbing less radiation. I am not entirely sure what I am seeing here yet, but these results at least confirm the sensitivity of the IR platform to relatively small variances in organic carbon. Sensitivity will be favorable in the context of Icelandic soil because it is mostly composed of andosols, which are under 25% carbon. The next steps are to rerun these standards, run a few standards that should be 0% organic C but are of a different chemical composition, and run samples with %C between 0-25%.

I have also been working a lot on the field probe. I need to do a quick field test to determine how important it is that soil conductivity and moisture content measurements are taken in the field vs. on the bench. Right now the field platform includes an IR temperature sensor, a moisture content sensor, and a conductivity sensor. I am currently debugging the existing Arduino code for this platform to be compatible with a different sensor pinout.

This past week Charlie and I discussed the sample plan for the glacier. Using what we have learned from recently published resources on glacial chronosequencing, and troubles with the sampling location in 2014, we think we have a rough plan for how to sample on the southernmost glacier.

Field Day had some internal work done

with No Comments

If you’ve read my last post, you know that Field Day got a external makeover. It also got a lot of work done internally. For the past couple of weeks, Deeksha, Charlie and I have been working on the new data model for Field Day and the PostgreSQL database on hopper (or our portable machine). We’ve finally figured out the first pass. As you know, this could change as we move forward and test our designs, but this has gone through many field practices. There’s more than one table now — there’s pretty much one for each data point we are collecting (sensor, platform, host, site, sector, etc) all of which have unique keys and all of which will be available and populated before we use it in the field. This week, I integrated that into Field Day.

We decided that we wanted Field Day to connect to a remote database and retrieve all of the table data and store it into a local database. Field Day populates sites and sector drop downs in the ‘Take a Sample’ dropdown from which the user can choose the site and sector they want at that stop. Field Day can also check whether or not the platform and sensor they are using are in the database. Currently, Field Day fails if it can’t find the platform, but I’ll be making this more robust this week. Allowing the user to retrieve external database data will prevent inconsistencies with spelling, capitalization, human error, and the like which are problems we’ve had in the past.

New design!

with No Comments

This past week has been busy! I’ve done a ton. One of the things I’ve done is make Field Day look a little prettier. I find it much easier and productive and effective to work on if the application is prettier and nice to look at. Go back to my previous posts and you can see that Field Day was ok looking, but it was really dark and boring. Now it’s quite pretty and fun. I got rid of the circles and just made it icons without a background. I also made it look like the user is in a field, hence ‘Field Day!’ There are probably some other things that I could add, but for now I think it’s pretty and much nicer to work with. You can see pictures of it below.


fieldday-main fieldday-sample

Ambiance and a Feather

with No Comments

So, it’s been a little while since my last post. Here’s a quick update. I assembled our ambiance platform using the Adafruit feather and two sensors: Altimeter and Temperature, Humidity and Pressure. The Adafruit feather is a tiny BLE capable micro controller (like a Light Blue Bean). We decided to go with the feather because the BLE chip it uses is Nordic, like the Red Bear Labs BLE Shield. With the Nordic chip we can make our own services with UUIDs. The Bean has a built-in set of UUIDs and communicates differently than the Nordic chip.

The platform sensors currently use two different communication protocols: I2C and SPI, but we decided that probably wasn’t going to be a problem. I was able to solder on the sensors to a prototyping board and upload a sketch. I tested without the BLE first time to make sure it was working. It was, thanks to sample code from Adafruit! Adafruit has a different BLE library but it’s all the same principal. I tested the BLE code with Field Day and all works well. A picture of the ambiance platform is below.

Scheming…

with 1 Comment

After a week or so of tinkering we have a new version of the database schema that supports Field Day and the visualization stack. Here is the fancy entity relationship diagram for it:

IMAG0420

Field Day will load trip, site, and sector information from Postgres (config option) and cache them on the tablet. Deeksha is committed to moving the data from Iceland13 & 14 and Nicaragua14 into this new structure.

1 2 3 4 5