Back into the swing of things

with No Comments

Now a few weeks into the new semester its time to stop procrastinating and get back to work!

Ive started off by essentially doing what seems like mass updating of hardware, software, firmware, etc. The DJI drone system and ground control software both had to be brought up to date. Initially there were a lot of errors in getting them talking to one another again but as of Wednesday this week they are fully happy and working properly. I’ve also taken the chance to update the plug-ins and various parts of the website. Ive also made accounts on the blog for Vitalii and Niraj who will be joining us by working on some of the back end coding.

In an effort to stream line our massive photo cache I’ve copied all photos onto our media server here on campus to allow us to situate things. After talking with Charlie and Erin we have decided to sort initially by day and then by capture device. This means though that we have to map all photos to their correct day which has proved to be more difficult then I thought… If the EXIF data on the images doesn’t contain a date – the date is just set to be the most recent “creation date” which means when I copied them. Thats left me and Erin with a whole lot of images that need to be sorted and sifted by hand still. Im also still finding places where images are stored, such as the google drive, etc, and have been working on getting all of those to the server as well. Its sort of like a  big game of cat and mouse and is tedious at best.

With Niraja and Vitalii joining us I have also been doing my best in catching them up to speed on all the projects and details there in. Much of this involves working with the UAV images and how to post process them. Much of this is trying it out on proprietary software and then figuring out to best do it in large batches and with open source programs. Ive most recently been trying to figure out if its possible to get a 3D topographic image without needing to apply a LIDAR point cloud layer. While not as accurate it would certainly be quick and would be used more as an approximation.

As time becomes available, Ive also started going through all the video footage that we have saved and started to throw together a very (VERY) rough storyboard for the documentary. Im hoping to have a solid chunk of time this weekend to work on this a bit more. Really I’m just focused on getting some generic shots worked together so that we can use them as filler for voice over and context.

As things move along I’ll keep posting! Cheers!
Data update

with No Comments

This past week, I worked on getting some database views ready that would show us the results for the sampling day. This is so each evening in Iceland, we’re able to effectively and quickly QA the data we have and check to make sure what we have matches with what we should have. This is now set up so that we have views of data from the last 24 hours for both streaming and readings tables in the database. The views are currently set up so we can see the recordtime, latitude, longitude, elevation, sensortype and sensor value for the streaming table. The readings table view displays the time, site, sector, spot, sensortype and value for the last 24 hours.

I also finished up the ER diagram for the data model as it now stands in our database with a couple of changes from the last iteration.

I began working on learning enough about flask this week to start adapting the viz tool to work with the current data model, and expect to make more headway on that this week. I also started writing up and documenting all our tables and why we chose to structure them the way we did, along with explanations for the relationships between the tables and how we chose those.

Data Progress

with No Comments

This past week, the new data model was implemented after some K,C and I talked about it for the past few weeks. We now have multiple tables in the model, with a table for basically every data point. I have been looking at Iceland 2014 data to figure out what data we can move over into this new model. I’ve learned that there isn’t very much data we’d like to move over from Iceland 2014, although almost all the Nicaragua data is good to move over (in the fall, once we’re back from the Iceland scrum.) The distance function came in really handy here, and made me really glad that we finally all have the old data in a single, easily searchable place. We’re not moving the data over into the new model, but it’s easy to query it where it is now (something that hasn’t been possible for a while)


So for now, we are keeping all the Iceland 2014 and Nicaragua data in the old model on Postgres, and focusing on this years’ data, and getting that working in time.

Field Day had some internal work done

with No Comments

If you’ve read my last post, you know that Field Day got a external makeover. It also got a lot of work done internally. For the past couple of weeks, Deeksha, Charlie and I have been working on the new data model for Field Day and the PostgreSQL database on hopper (or our portable machine). We’ve finally figured out the first pass. As you know, this could change as we move forward and test our designs, but this has gone through many field practices. There’s more than one table now — there’s pretty much one for each data point we are collecting (sensor, platform, host, site, sector, etc) all of which have unique keys and all of which will be available and populated before we use it in the field. This week, I integrated that into Field Day.

We decided that we wanted Field Day to connect to a remote database and retrieve all of the table data and store it into a local database. Field Day populates sites and sector drop downs in the ‘Take a Sample’ dropdown from which the user can choose the site and sector they want at that stop. Field Day can also check whether or not the platform and sensor they are using are in the database. Currently, Field Day fails if it can’t find the platform, but I’ll be making this more robust this week. Allowing the user to retrieve external database data will prevent inconsistencies with spelling, capitalization, human error, and the like which are problems we’ve had in the past.

Scheming…

with 1 Comment

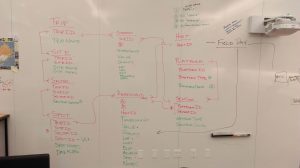
After a week or so of tinkering we have a new version of the database schema that supports Field Day and the visualization stack. Here is the fancy entity relationship diagram for it:

IMAG0420

Field Day will load trip, site, and sector information from Postgres (config option) and cache them on the tablet. Deeksha is committed to moving the data from Iceland13 & 14 and Nicaragua14 into this new structure.

Databases, and lat long functions

with No Comments

Since my last post was a a very long time ago, this is what has happened with the data clean-up over the past weeks:

Eamon and I both cleaned up all the data we could find individually. Since we’d worked separately, when we compared the cleaned data sets that we each had, they turned out to be different. Neither of us had all the data individually, but when our data sets were combined, the list was exhaustive of all permutations of Iceland 2014 and Nicaragua 2014 data. Then, with Charlie’s help, we were able to determine which of the data sets we needed to zorch. It turns out that a significant chunk of our data sets needed to be zorched, because we each had thousands of rows of testing data or data taken in the car while the group was driving.

After much too much time wrestling data in spreadsheets, the readings table is finally in the field science database where further clean-up relating to sectors and spots can be done. As of right now, most Iceland 2014 data has no sector or spot data. With Charlie’s help, I can now populate the sectors.This should be way quicker to do by date, time stamp and lat long coordinates now that we have it all in the database.

Next up, I will be working to create/adapt a function that measures the distance between a pair of lat long coordinates. This should help with further clean-up and with the bounding box interface.