The low point of my day…

with No Comments

As near as I can tell from a quick look at the data collected by Field Day and Grace (our prototype ambiance platform) and the Yocto altimeter (based on the same MPL3115A2 chip that we use) this was the low point of my day yesterday at about 201m:

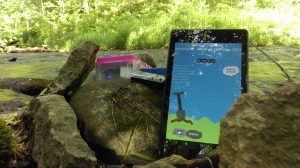
IMAG0439

I started Field Day and the Yocto around Portland, Indiana and then drove home and walked down to the creek where this picture was taken. The highest point in Indiana is about half-way between Portland and where we live in Boston. The creek bed is the limestone floor of the ocean that covered this part of the US about 350mya. Neither device was calibrated, and we won’t know for sure how the track looks until Craig maps the data, but things are looking good.


In other news Nic has collected data from the LiDAR in the lab as it moved slowly over an object on the floor. We’re collecting theta, distance tuples at set intervals (1cm) along the track, I think we can visualize these as stacked wind roses as a first-order approach to “seeing” what it found. Matplotlib to the rescue!
LIDAR on mac

with No Comments

As I mentioned in an earlier post, I had only managed to get a working ros lidar work station (environment) working on an ubuntu virtual machine. There are several issues with this though; all of our other developing environments are already in OSX, getting the /dev/ ports configured correctly to ubuntu through OSX is brittle at best and if something goes wrong it borks the entire virtual machine (its just faster to re-install than to actually fix the problem manually), and running the ubuntu vm cuts down on the battery life/processor/ram of the hardware. So with this in mine getting the environment up and running on mac has been a priority.

I was successful in being able to build a working “basic” work station on mac running OS X El Capitan (I’ll put instructions in the gitlab). The basic work station can’t do much except actually launch the visualisation app rviz or any of the other tutorial apps. The next step is to dive into the lidars available SDK for the mac architecture and build a node from that capable of pushing information to the sensor into the visualisation (and other nodes). Luckily the SDK is available in python and C flavours so hopefully it won’t be too complex.

LIDAR Mapping

with No Comments

Okay, so success has smiled upon me (for once)! After many, many, many, many, trials I finally got the LIDAR to map in a real time slam visualisation (I will upload a video example asap). ROS works using a subset of “nodes” for each application, sensor input, etc. So in order to get the slam vis running you have to have the main the LIDAR input stream node running, the slam node running, and then tell them all where to dump their data before finally launching the ros visualisation and hoping that it all works together. Rather than starting them all one by one manually I made a launch file (variation of a bash script) that does everything in the background. I’ve also created a git on the gitlab with some simple instructions, work space and launch files that I’ll update and add more to as time goes on.

Now that the mapping is up I can work on getting things calibrated. The LIDARneeds to be able to map when held sideways and scanning the ground rather than in a single 360º plane. The plan is to take advantage of its positioning. When the LIDAR is not perpendicular to the ground it will simply shut off the laser and not record data points, this way our final “scan” will only be those taken within a tighter angle boundary. Once this is working Ill be trying the LIDAR scanning at 3m (10ft) and see how accurately it picks small objects up. This will translate into how slow the drone has to fly to achieve maximum map resolution.

The other week when I was forced to take the LIDAR unit apart I was able to examine the internal design. The end goal with the LIDAR is to be able to sweep a flat ground surface, this means that we will have to limit the beam to ~30º beam angle. The simplest way to do this will by a custom top housing. The inside part of the top housing will spin freely on its own while the outer part of the top housing will be fixed with a limited view “window.” It will have to be from a material that won’t reflect the laser as to not gather bad data points while its spinning inside the device (though, it would be fairly simple to find these data points and ignore them in the code). Charlie also made the suggestion that the viewing window of the outer housing have shutters of a sort that allow for a change in view angle.

I love the details…

with 1 Comment

The past week has been .23 zillion small things. A few travel related, a few data, and a lot of sensor platforms. The UAS and LIDAR gear is in-house, so far Nic has made the LIDAR spin (he said it was “working”…) and the UAS has charged batteries. I’ve been meeting with Anna and Katie looking at measuring the voltage potential generated by the pH testers. Anna and I worked-through the software architecture for connecting Arduino-based sensors to FieldDay via BlueTooth. There is some data aggregation to be done on the Arduino, and we should probably look at George’s libraries.

Tara and I built a rig out of Lego for spinning 50ML Falcon tubes, if the basic principle works we can fab it out of “real” materials. That was so much easier than the last thing she asked me for, a suction filtration device on the Sunday after Christmas in Leon, Nicaragua.

I worked with Deeksha and Eamon on the data organization, cleanup, visualization, etc. It’s moving along albeit a tad slowly.

The Lilly map sale is today, I’m going to see what I can find for topos of the Wayne county area that we can use for testing the orienteering gear. Kristin and I were interviewed by Mark Brim about how we collaborate, that was fun.