The following is a summary of our meeting on October 6, 2015.
Deeksha has been working on a ‘master table’ of sensor and ambiance data from both Iceland trips and Nicaragua. She is now working on grooming it to be internally consistent before we push it up to the field science SQL server. Kristin observed that even data without an associated metagenomic sample is worth curating in the SQL table.
Charlie, Kristin and Nic have met to discuss the field science app and have started working together on improving it. Kristin has updated the main page of the app and improved its aesthetic design and has come up with the name, ‘Field Day’, for the app. ‘Field Day’ was received very well by everyone at the meeting. The ambiance platform is moving away from Yocopuce and towards Arduino. Four LightBlue beans have been ordered.
Each of the soil platforms are coming along well in the prototyping phase. The field sensor will use bluetooth – possibly a LightBlue bean or a bluetooth shield. I (Tara) am planning to use the Arduino UNO as it is a very sturdy and well-documented board.
Erin has been communicating with Bernard about bird life in Iceland and has obtained a list of species nesting around Skalanes. She is looking into nesting times so we have a better idea of which birds will be nesting in the time frame of our visit. Ben and Erin have been vetting the Fluke IR camera for use in mapping bird life (there isn’t a lot of documentation on this usage because it is relatively uncommon, but there are many reasons to believe it will work very well). They plan to test it out on squirrels and birds around Earlham. They are also looking into the possibility of using balloons for the bird nest survey. Charlie pointed out that a balloon with a tether could provide a relatively easy way to survey an area form a constant elevation.
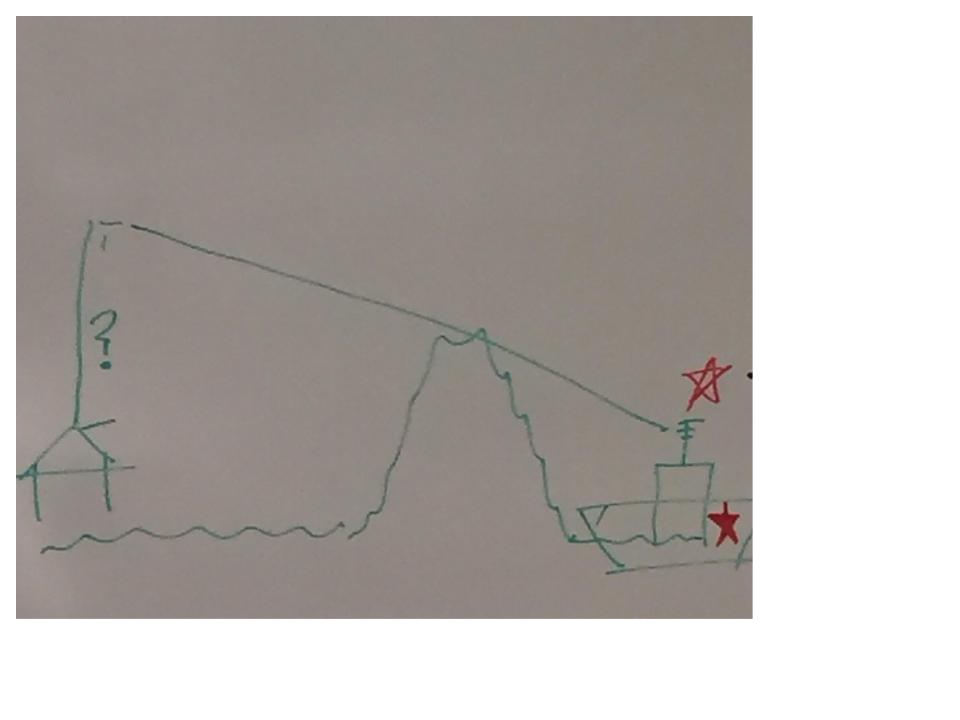
Another possible use for balloons is setting up an internet connection for Skalanes. We need to know how high a balloon with a wifi antenna would need to be for the signal to clear the mountains in between the station providing signal and Skalanes. Erin will be looking for the point of maximum elevation between Skalanes and the station on google Earth in order to answer this question.
Eamon is working on a set of tools for data visualization downstream of the data curation Deeksha is working on. Charlie observed that, in the field, a visualization tool that allows us to check the coverage of our sampling would be extremely useful. If we missed a section of our site, we would rather know about it while it’s still an option to go back and gather more data. Charlie is envisioning an interface that prompts the user for the geographical area they want to look at and the sampling day(s). The program could return sampling data plotted by geocode on a map of the sampling site. This would allow us to check our coverage. A tool like this would be invaluable for use in the field. It could also be evolved further for visualizing the data after we return including genomic post-processing data such as 16s sequencer output.
Leave a Reply
You must be logged in to post a comment.